Calltracking: Dashboard
You can see the call tracking statistics in the Calltracking → Dashboard section:
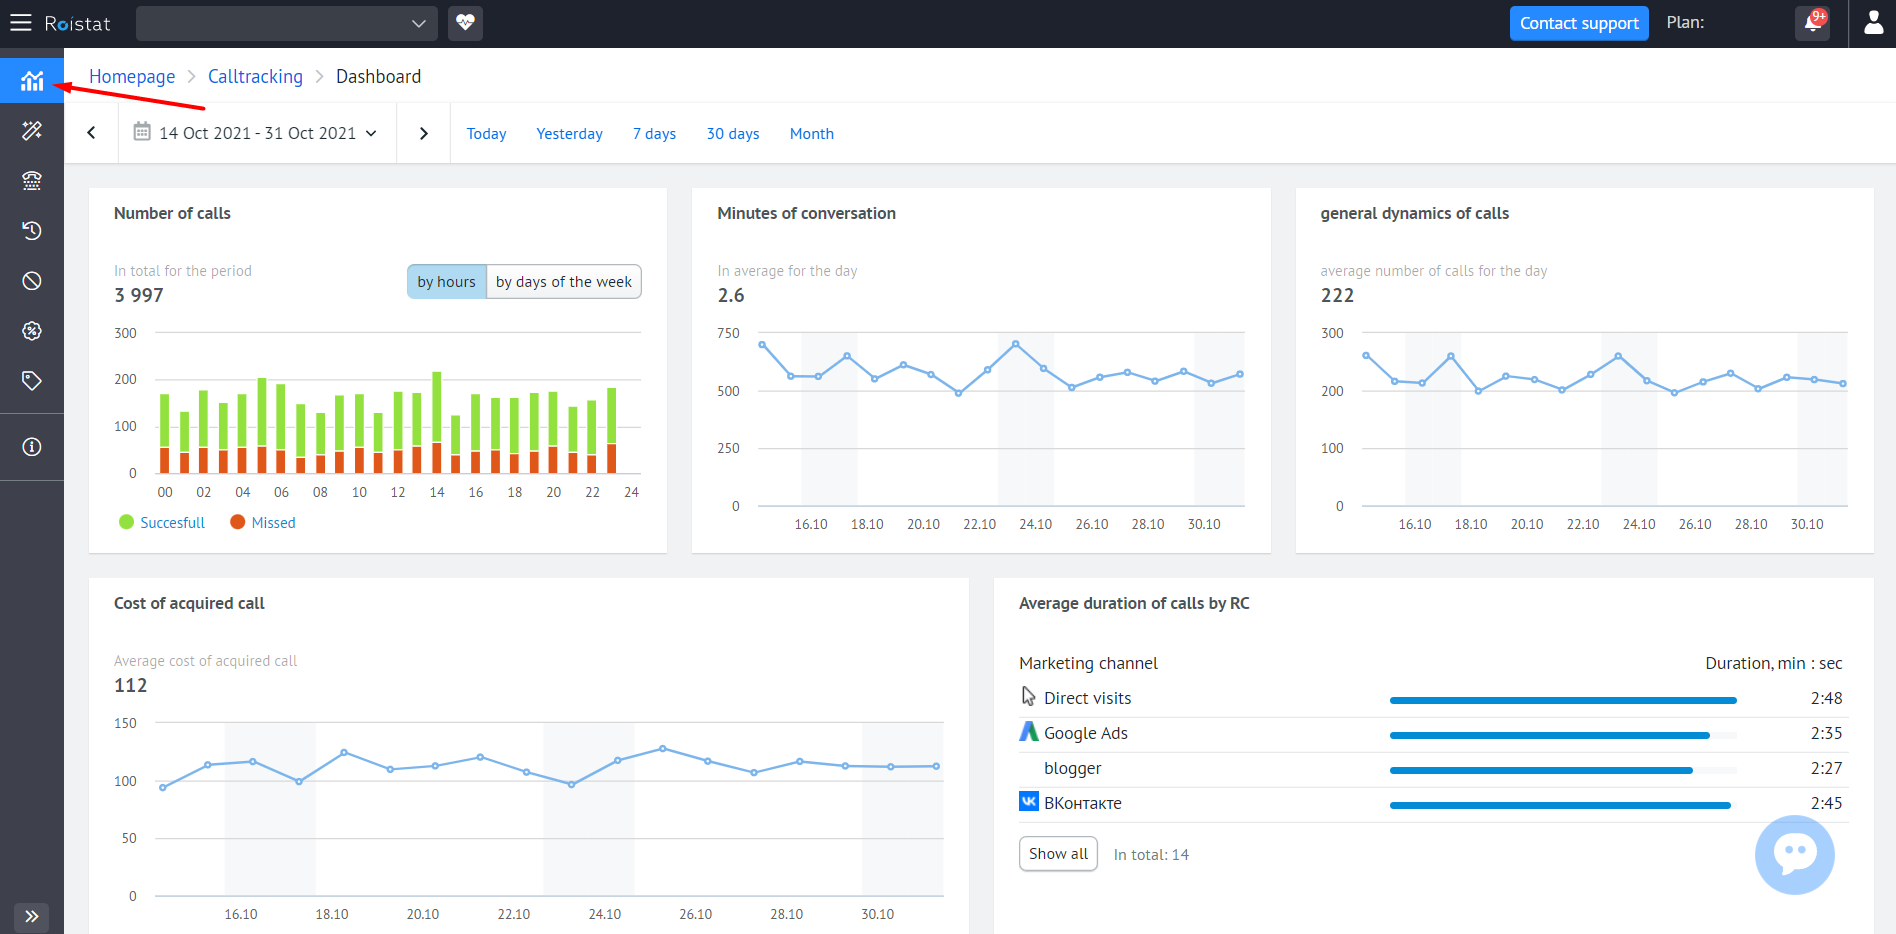
The Dashboard consists of multiple reports displaying the statistics on the following call tracking metrics:
- Number of calls (answered and missed);
- Minutes of conversations (by days and expenses by these calls);
- General dynamics of calls;
- Cost of acquired call;
- Average duration of calls by marketing channels;
- Distribution of calls by marketing channels (top 5 channels) and by regions (top 10 regions);
- Distribution of calls by numbers.
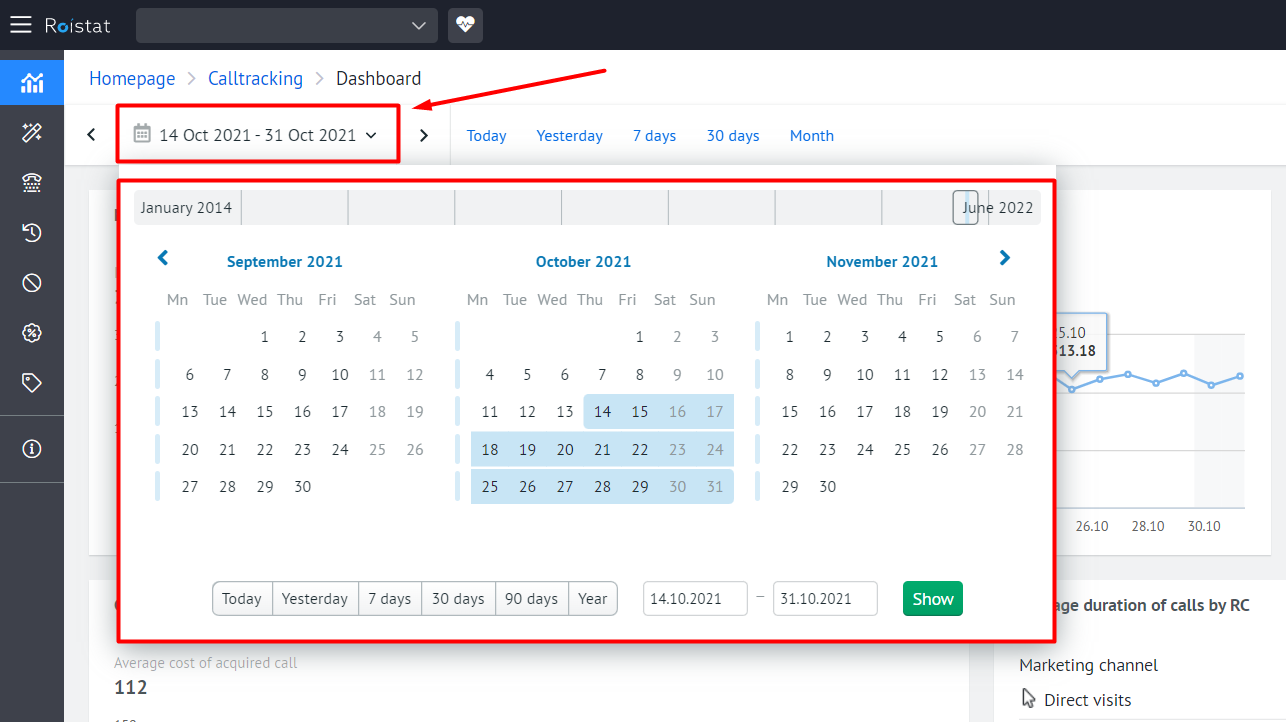
The reports display statistics for the selected period: today, yesterday, 7 days, 30 days, 90 days, year, or a custom date range:
Each of the reports can be used individually to achieve different business goals, and together they allow you to compare data both by calls and by advertising channels to which your numbers are connected.
Number of Calls
The Number of calls report displays the total number of calls for the selected period (the Total for the period field) and their distribution by hours per day or by days of the week. Using the report, you can identify call peaks and understand how many calls were missed in order to adjust the call tracking settings if necessary.
The number of calls on a particular day is displayed when you hover over the desired bar graph:
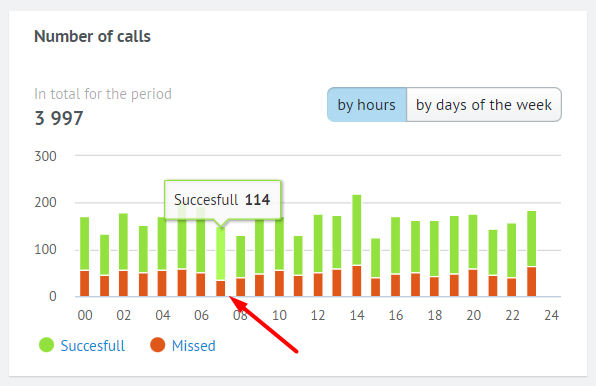
You can customize the report:
-
Choose the data display mode: By hours and By days of the week. To select a mode, click the desired button in the report.
-
Select the status of calls for which data is displayed in the report: Successful and/or Missed. To enable/disable the display of statistics for any call status, click the button with its name.
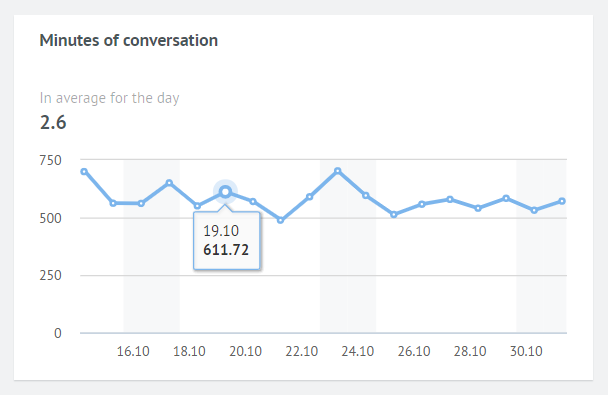
Minutes of Conversation
The Minutes of Conversation report displays statistics on call costs for the selected time period.
The Average for the day field displays the average cost of a minute of conversation per day for the selected period.
By moving the cursor over the graph area, you can see in detail the dynamics of changes in call costs by day:
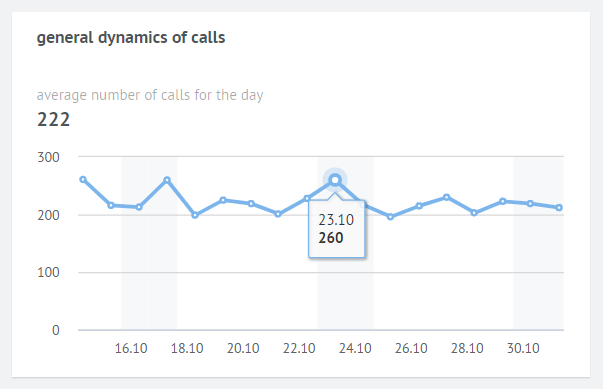
General Dynamics of Calls
The General Dynamics of Calls report displays statistics on the number of calls for a selected period of time.
The Average number of calls for the day field displays the average number of calls per day for the selected period.
By moving the cursor over the graph area, you can see in detail the dynamics of changes in the number of calls by day:
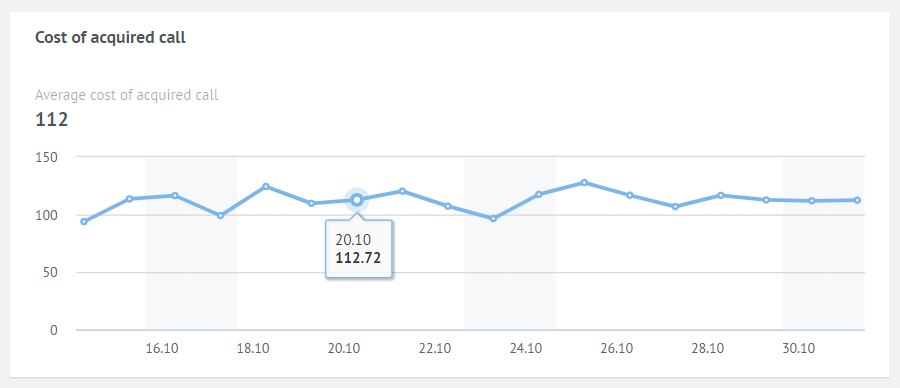
Cost of Acquired Call
The Cost of Acquired Call report displays statistics on the call acquisition cost for the selected time period.
The Average cost of acquired call field displays the value of the average cost of an attracted call for the selected period. By moving the cursor over the graph area, you can see the cost of an attracted call for any day within the selected period:
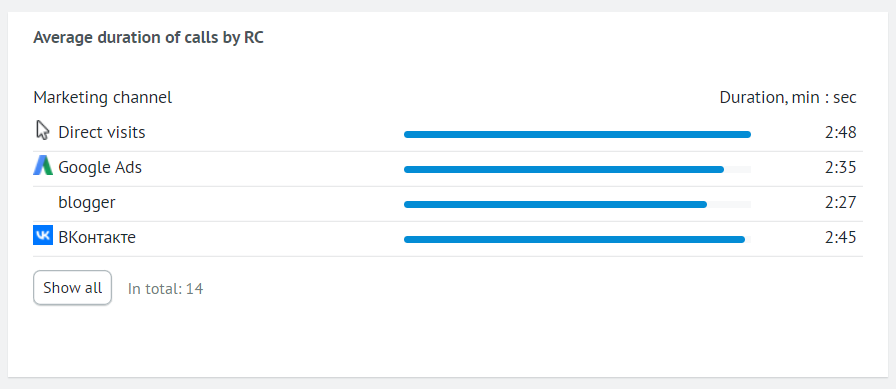
Average Duration of Calls by Marketing Channels
With the help of the Average Duration of Calls by Marketing Channels report, you can compare the average call duration for each connected advertising channel. This data is displayed in the Duration, min : sec column.
By default, data is displayed for only five channels. To view statistics for other advertising channels, click the Show all button.
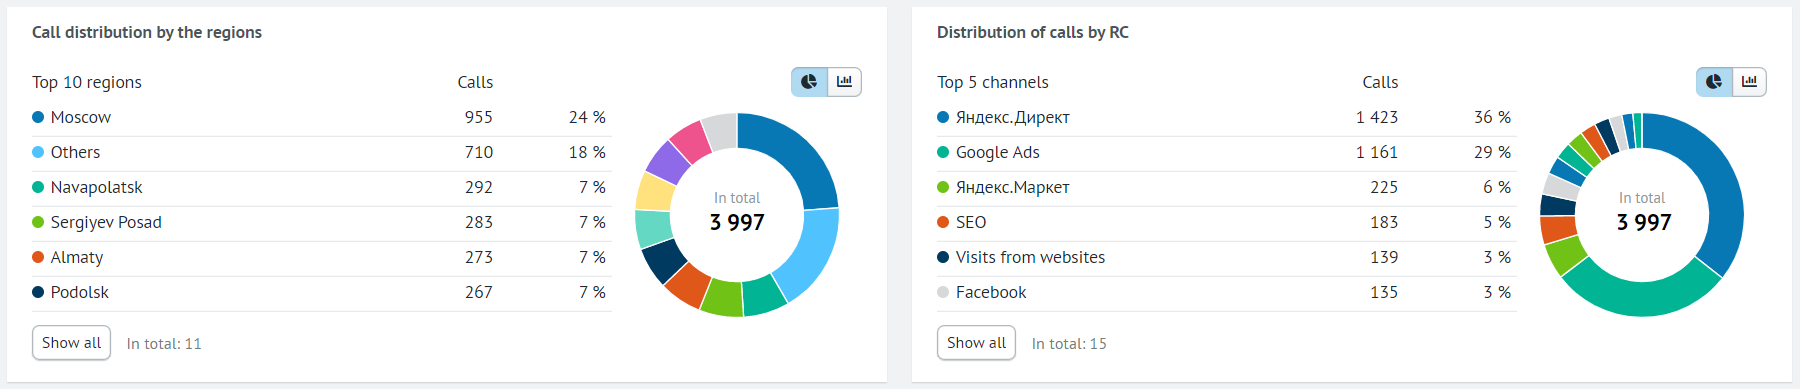
Distribution of Calls by Marketing Channels and Regions
In this report, you see from which marketing channels and in which regions people find out the telephone number of your company.