Reports
Description
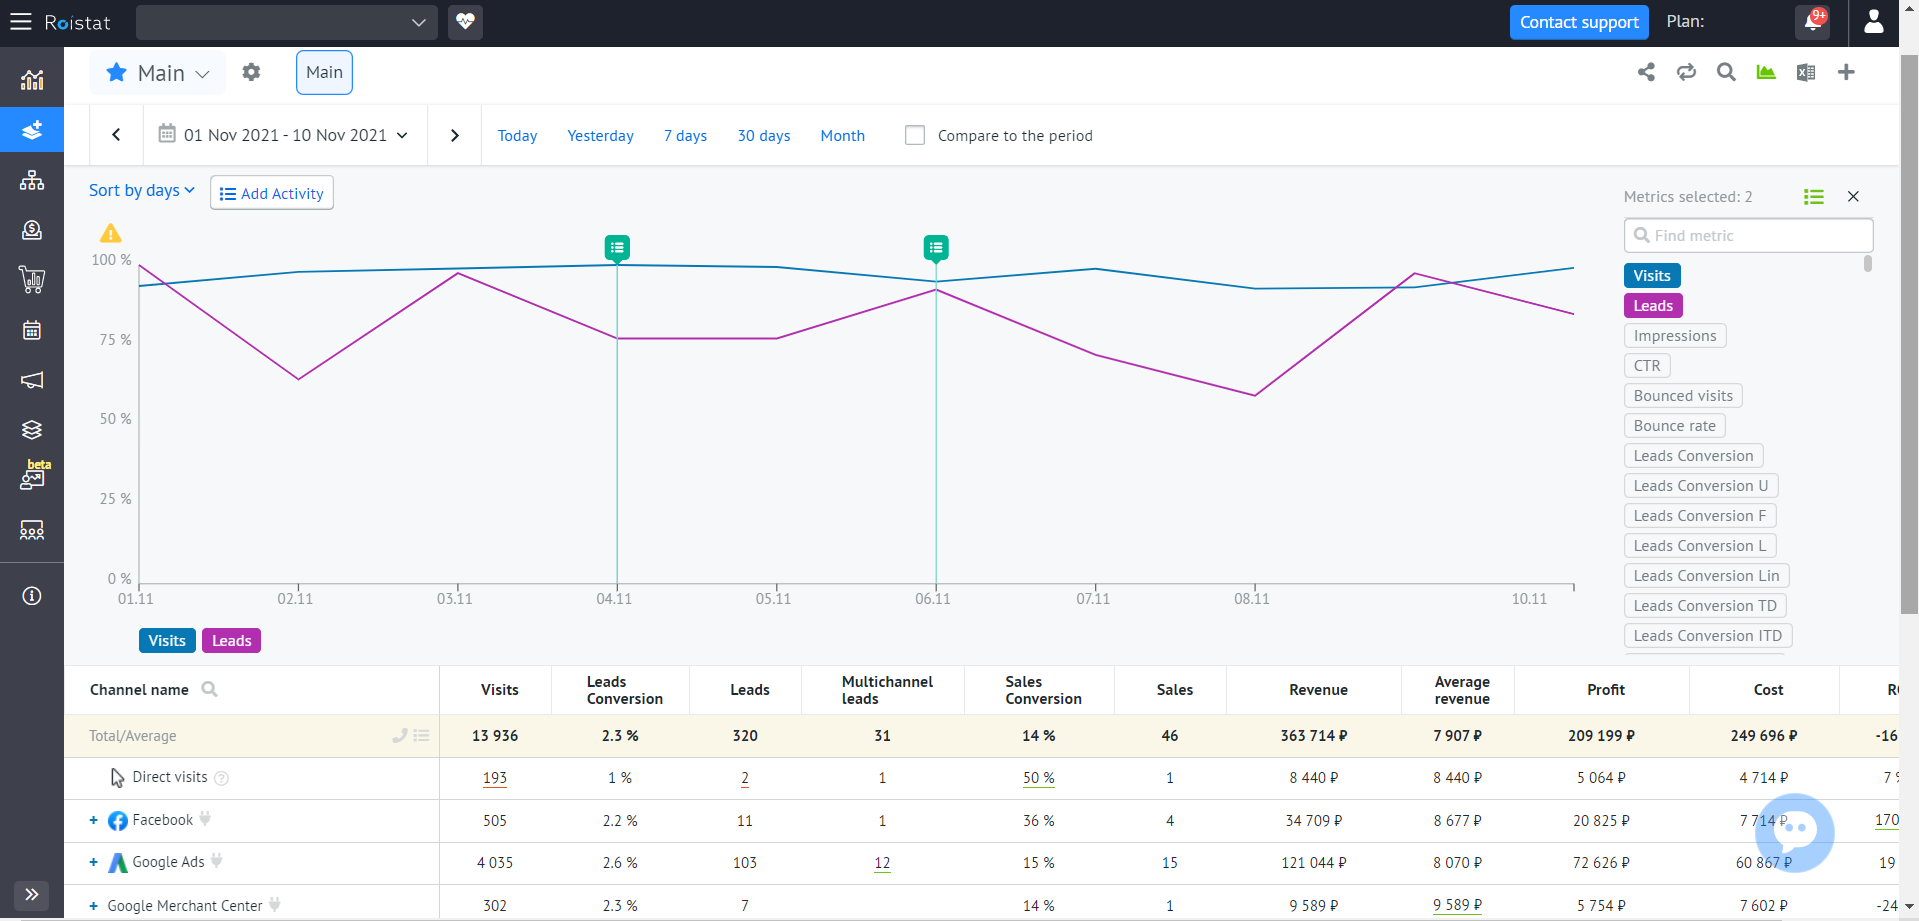
On the Reports tab, you can find all data on visits, requests, and transactions detected by the Roistat tracking code and received from integrated advertising channels and CRM:
The Reports tool allows you to:
- View statistics on business metrics for any level of the report – down to the keyword level;
- Generate reports on any groupings in a few clicks;
- Track changes in metrics on the diagram;
- Calculate metrics for different attribution models and compare their values for different periods;
- Highlight reports in different colors and sort them in the general list of reports;
- Download reports in Excel format and give other employees access to view them.
You can work with reports both in the Analytics interface and via the API.
Reports with diagrams are displayed on separate tabs. The number of reports in Analytics is unlimited. You can create your own report or use default reports: Main, By domain, By landing page, By the date of the sale, Ineffective keywords, Statuses funnel, Untargeted sources, Mobile devices, New clients, Sales and surcharges report.
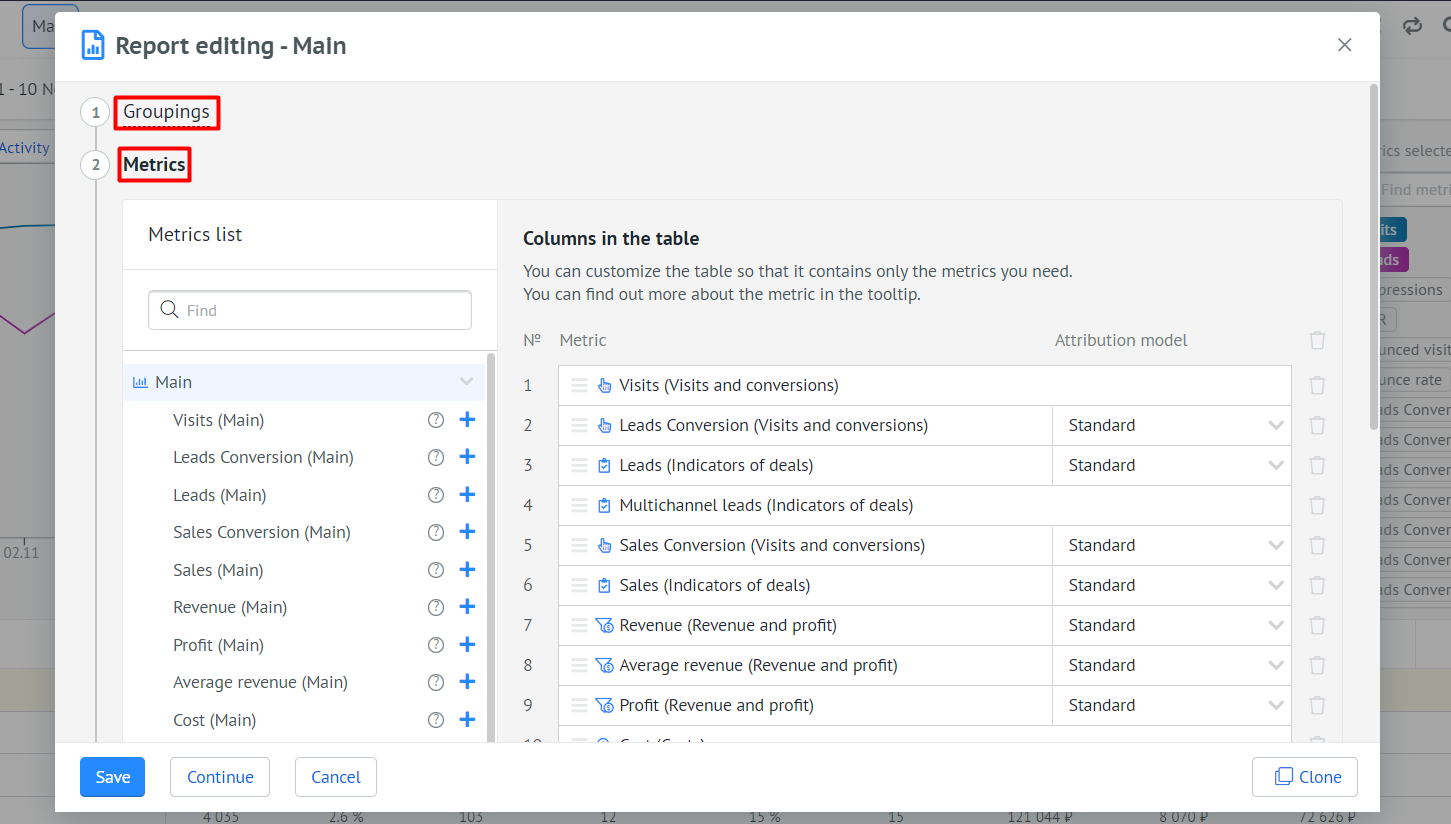
A report is a table consisting of rows and columns. Rows represent report levels, i.e. parameters of visits and deals from which statistics are generated. Columns represent business metrics. To create a simple report, select the levels and metrics you want to see in the report. You can do this when creating or customizing the report:
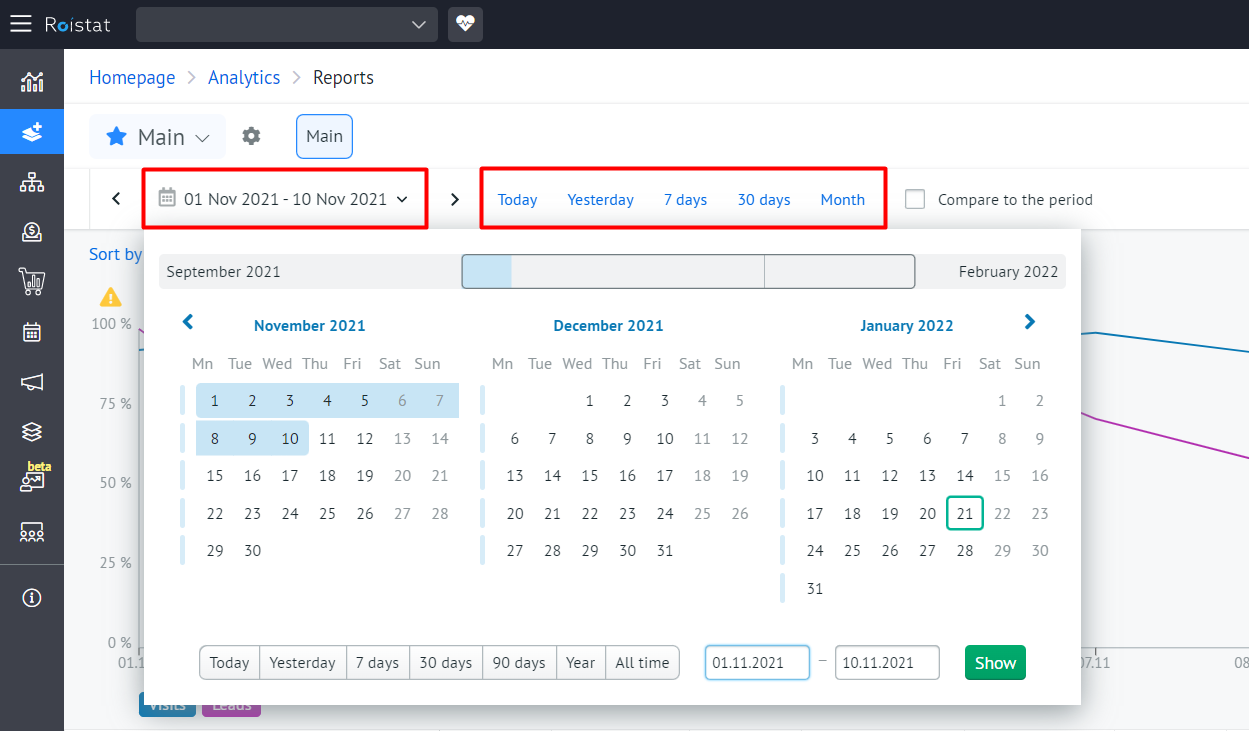
You can also select a report period: specify any period of time or select one of the standard options – Today, Yesterday, 7 days, 30 days, 90 days, Year, All time:
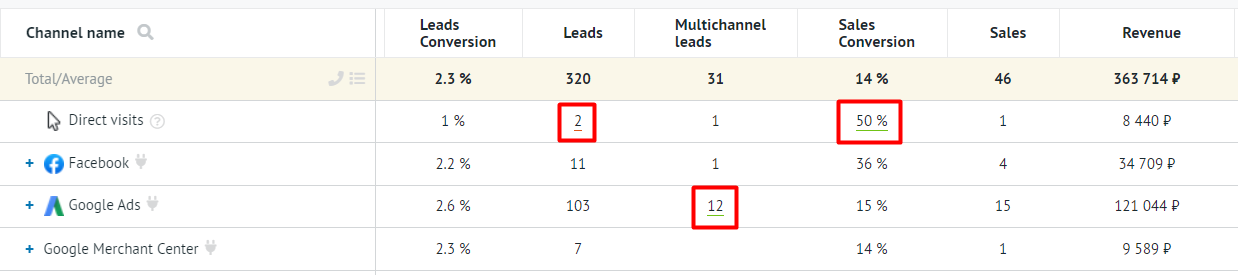
Some metrics in the report are underlined in red or green. Red indicates the worst value in the column, while green indicates the best one:
You can build a report for any number of visits.
Creating and Customizing a Report
Step 1. Choose a Report Template
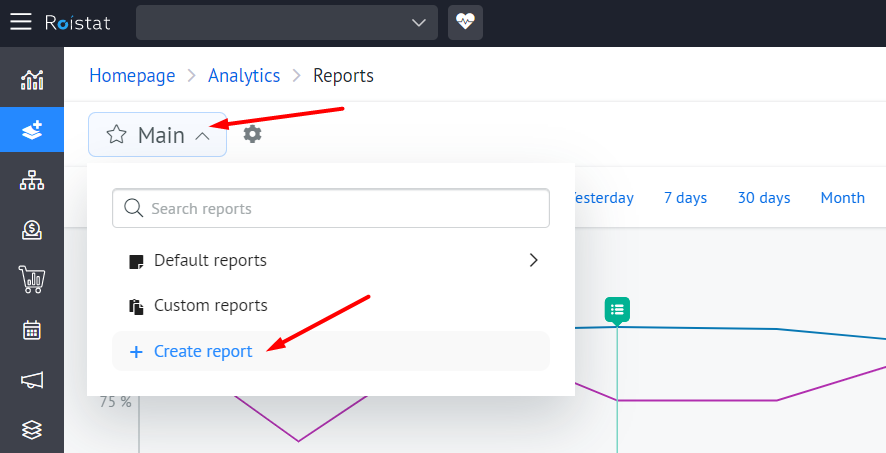
Click on the name of the current report and click Create report:
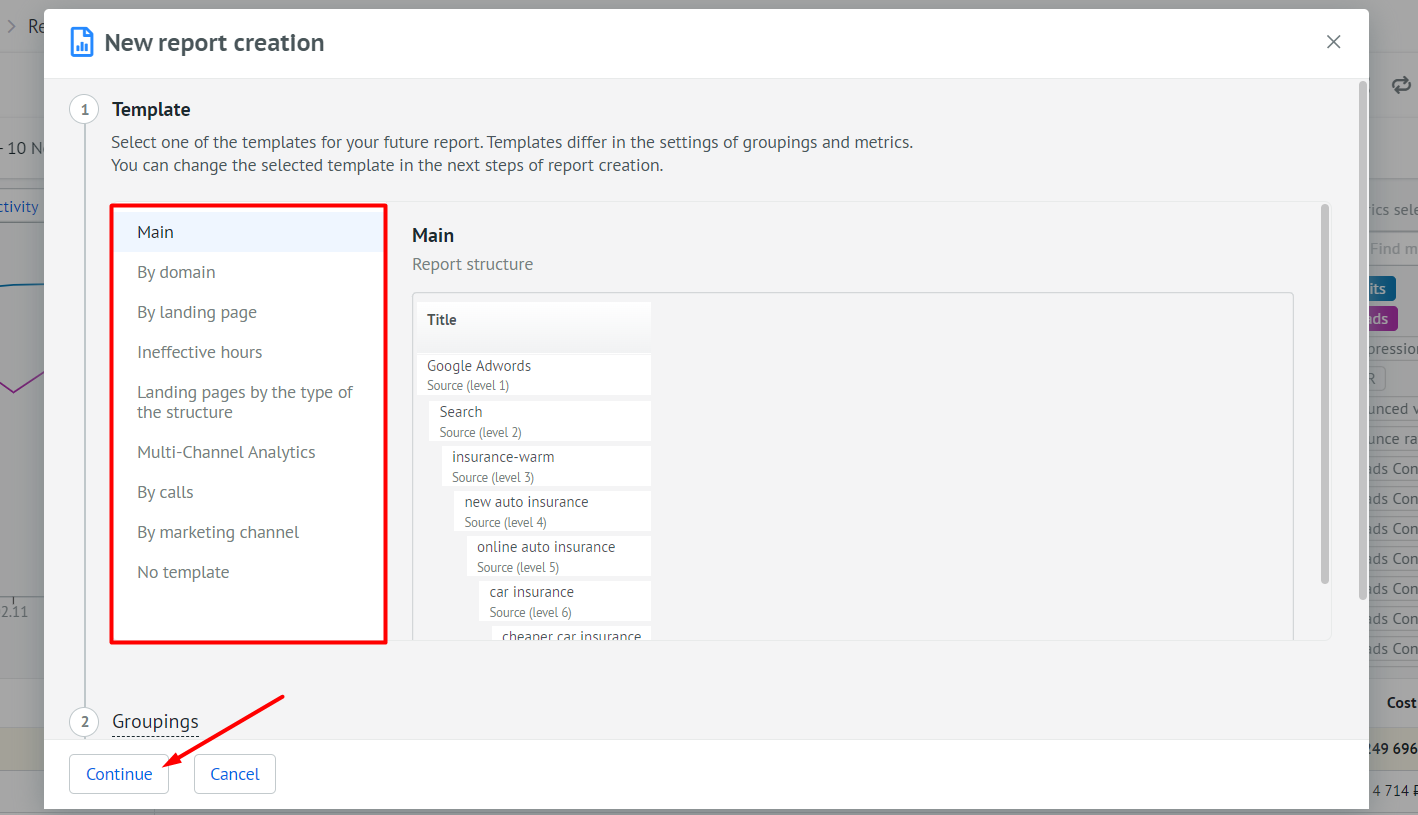
Select a report template and click Continue:
Step 2. Add a Grouping
Add a filter and select a grouping:

Groupings are the parameters of visits, leads and deals, for which statistics can be calculated:
- Advertising sources;
- UTM tags (only standard UTM tags are available for grouping);
-
Time of visit, lead and sale: hour, day of the month, day of the week, week, month;
Why do some deals fall into the "Unknown" section when grouped by time?
When this type of grouping is selected, you can only see the deals where the last visit was made in the selected grouping period (hours / days of the month / days of the week / weeks / months). If the specified period contains deals where the last visit was made outside the chosen period, these deals are displayed in the Unknown section. For example, you select grouping by days, and the report period is July 31, so there is only one grouping period in the report – July 31. The Unknown section will include deals created on July 31, where the last visit was made on a different day.
Why is the data on visits not displayed when grouping by the lead date?
To evaluate the effectiveness of marketing channels, select grouping by the visit date instead of the lead date. This is due to the fact that a visit does not always convert into a lead on the same day. If you select grouping by the lead date, data on visits will not be displayed, as the channel conversion may be higher or lower than the actual value.
Example 1: the client made the first visit on September 27 and left a request on September 28. If you select grouping by the lead date, this visit will not be included in the report for September 27, despite the fact that it converted to a lead. You can make a false conclusion that the ad for September 27 was ineffective.
Example 2: you selected the grouping by the lead date – September 28. The report displayed 15 leads: 5 leads from clients who made a visit on September 28, 10 leads from clients who made a visit on September 27. It may seem that all these leads were brought by the ad on September 28. However, if you select grouping by the visit date, it becomes clear that the ad on September 27 resulted in more visits, which eventually converted into leads.
-
Geography: country, region, city;
- Device and browser;
-
Leads: deal status, rejection reason, manager, lead's page (the page that the visitor opened last before leaving the request), method for creating a lead, sales cycle;
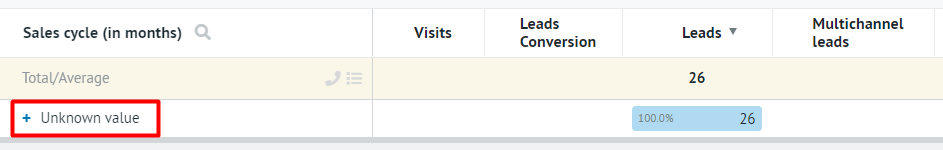
What is the "Sales cycle" grouping for?
The Sales cycle grouping allows you to see see how many days have passed between the creation of a lead and the sale. The report includes only those deals that were created in the period specified in the report settings. The number of days, weeks or months is always rounded down. For example, if 3 days and 20 hours have passed between the lead creation and the sale, the deal will fall into the 3 days grouping.
-
Events configured using the Events feature;
- Roistat parameters (roistat_param tags);
- A/B-testing configured using the A/B Tests feature;
-
Source page: source, source domain, display block, display position, search query;
What does the "Display block" grouping mean?
The display block is the display position of a Google Ads ad. The report on this grouping displays values like 1t1, 8t1, 10t3, etc., where the first digit is the number of the search result page, the letter in the middle is the location on the page (t means "above the search results", o means "below the search results"), the number at the end is the position in the search results. For example, the value 8t1 stands for page 8, display above search results, position 1.
-
Landing page and domain;
- Products: name, brand, variant, category;
- Additional deal fields.
After setting up the grouping, click Continue.
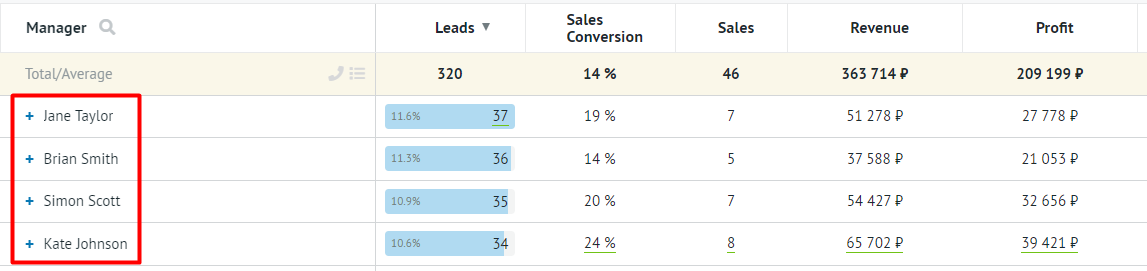
Grouping examples
Grouping by managers:
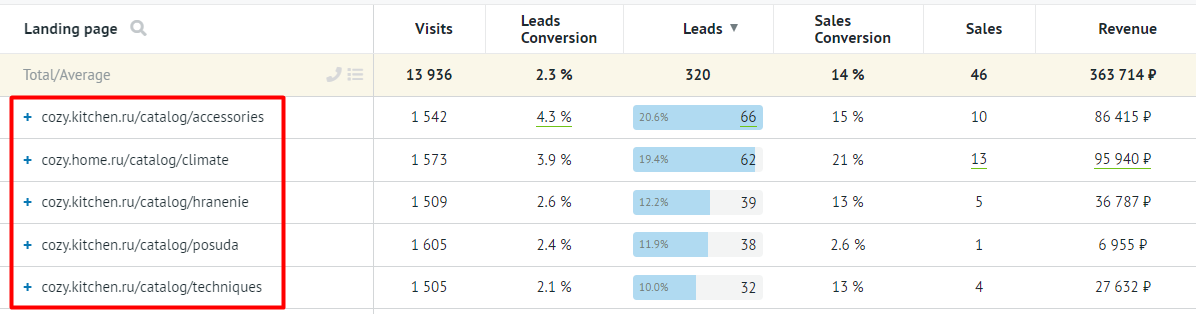
Grouping by landing pages:
Grouping Limitations
Advertising sources
For the SEO advertising channel in the Source (Level 3) grouping, search query values are not displayed. This is due to technical limitations of search engines.
Lead date
To evaluate the effectiveness of marketing channels, select grouping by the visit date instead of the lead date. This is due to the fact that a visit does not always convert into a lead on the same day. If you select grouping by the lead date, data on visits will not be displayed, as the channel conversion may be higher or lower than the actual value.
Example 1: the client made the first visit on September 27 and left a request on September 28. If you select grouping by the lead date, this visit will not be included in the report for September 27, despite the fact that it converted to a lead. You can make a false conclusion that the ad for September 27 was ineffective.
Example 2: you selected the grouping by the lead date – September 28. The report displayed 15 leads: 5 leads from clients who made a visit on September 28, 10 leads from clients who made a visit on September 27. It may seem that all these leads were brought by the ad on September 28. However, if you select grouping by the visit date, it becomes clear that the ad on September 27 resulted in more visits, which eventually converted into leads.
Products
In the Products groupings, only metrics related to products are displayed.
Additional deal fields from CRM
-
Metrics related to visits are not displayed:
- Visits;
- Leads Conversion;
- Sales Conversion;
- Absolute Conversion;
- Canceled Leads Conversion;
- Cost;
- ROI;
- Data on calls (for example, Unique calls).
This is due to the fact that the costs for visits and additional deal fields are not related to each other and are not comparable in this form.
Please note: Method for creating a lead is a Roistat grouping by an additional deal field. This value can only be tied to a deal, not a visit.
-
You cannot group data by additional deal fields from CRM if:
- Additional field name is roistat, is a number, or contains UTM;
- Additional field value is an empty string, email address, date, URL, JSON; it contains UTM; the number is greater than 1000; the string is longer than 1000 characters; there are more than 10000 value options.
It is not possible to group data with a number greater than 1000, because such a grouping would be uninformative due to the large number of rows.
Example: deals have an additional field called Additional information. Values of this field for different deals are the following: test1, test2, test3, test@test.com, 1234, 01/01/2017, utm_medium=cpc, json, url. If you group the report by this field, you will see statistics on deals with the following field values: test1, test2, test3. Other deals will not be included.
Step 3. Choose Metrics and the Attribution Model
Select the metrics you want to see in the report and the attribution model for them:
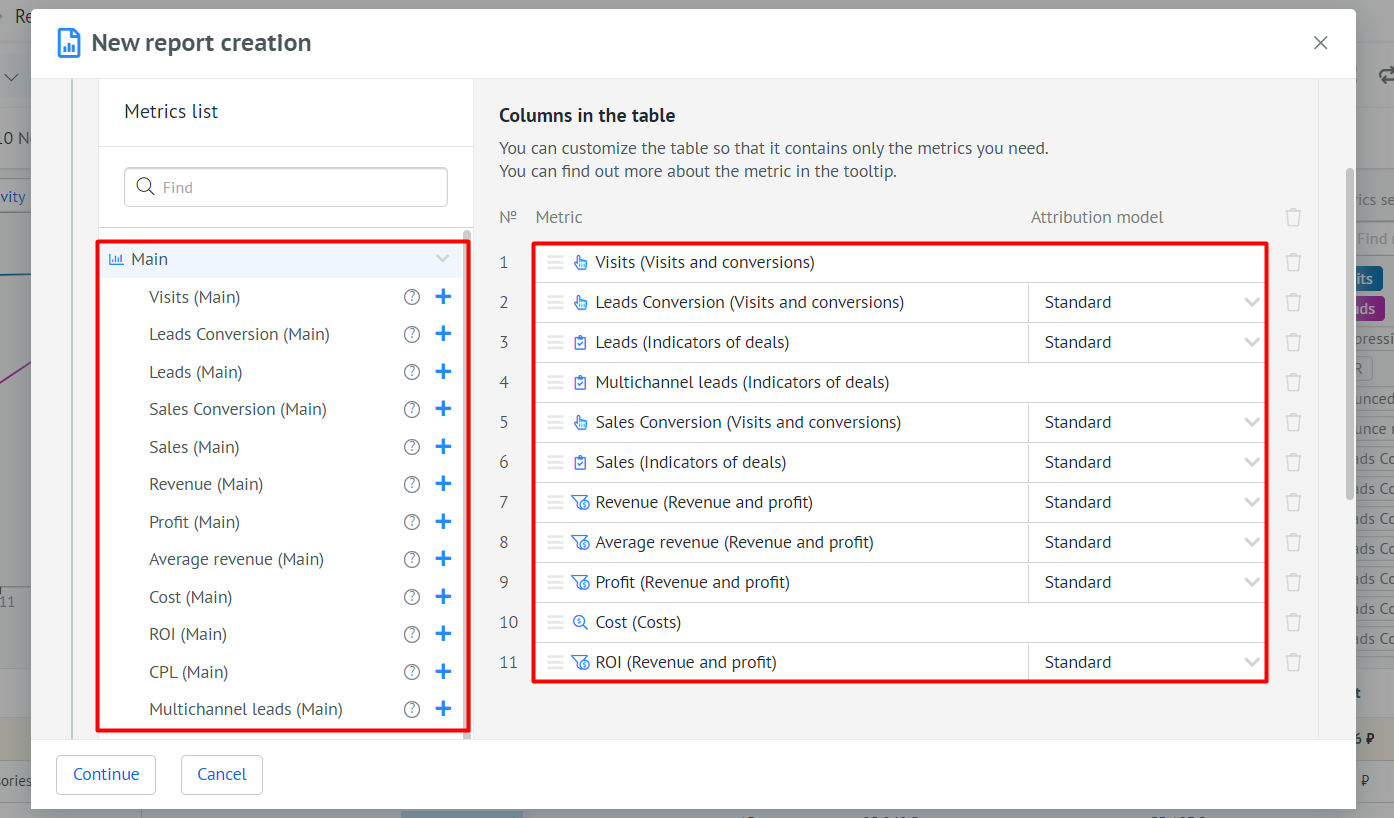
To add a metric, click the plus icon, to delete it click the trash can icon.
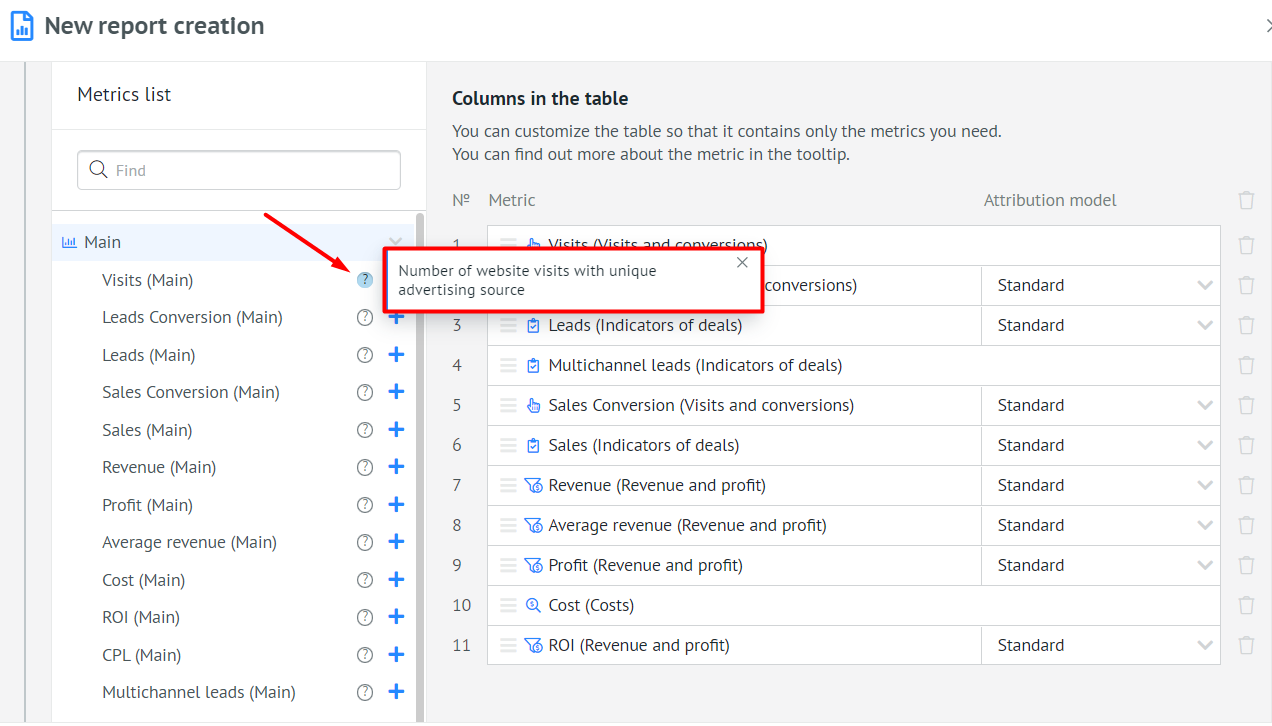
For information about the indicator, click the question mark icon:
By default, the Analytics report is based on the lead date: it displays all deals created for the period specified in the report settings. You can configure the Analytics report to be based on the sale date.
Step 4. Save the Report
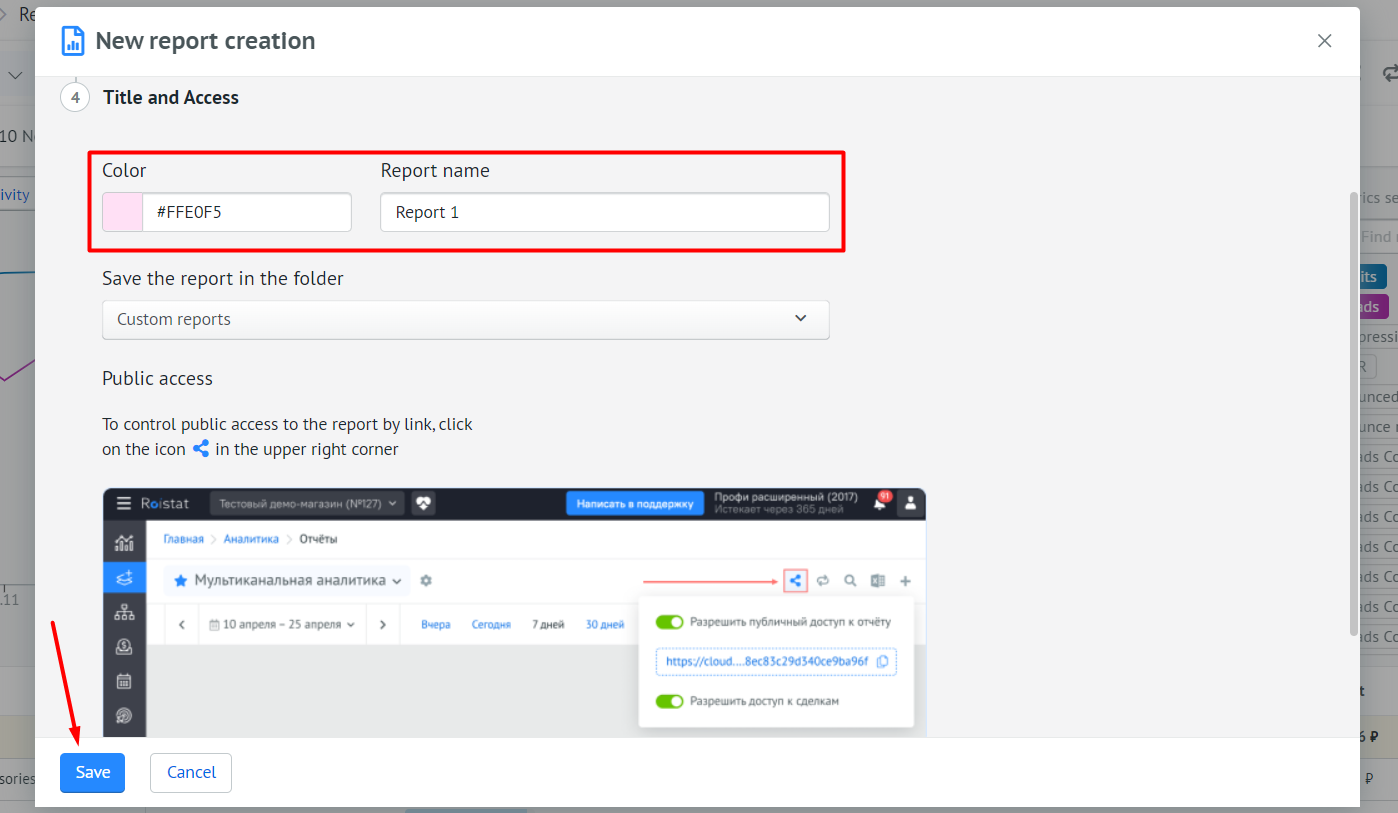
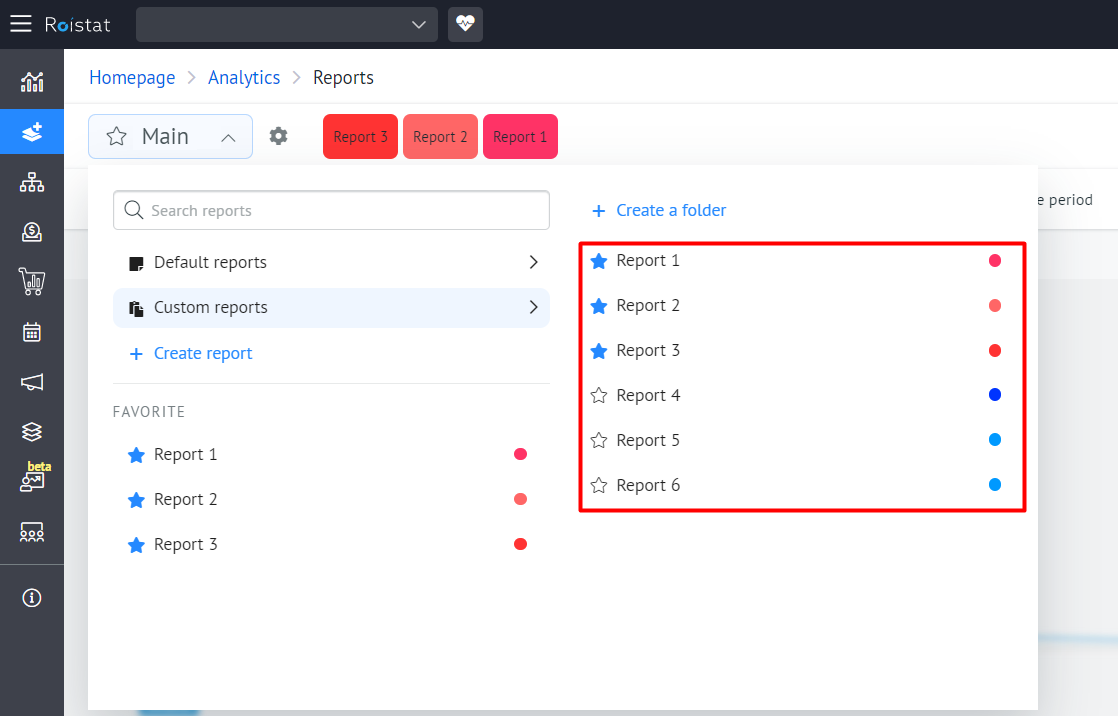
Name the report and select a color for easier navigation in the list of reports. Click the Save button:
For example, you can choose red tints for one group of reports and blue tints for another. This will help you navigate the list of reports faster:
Saving a Report to an Excel Spreadsheet
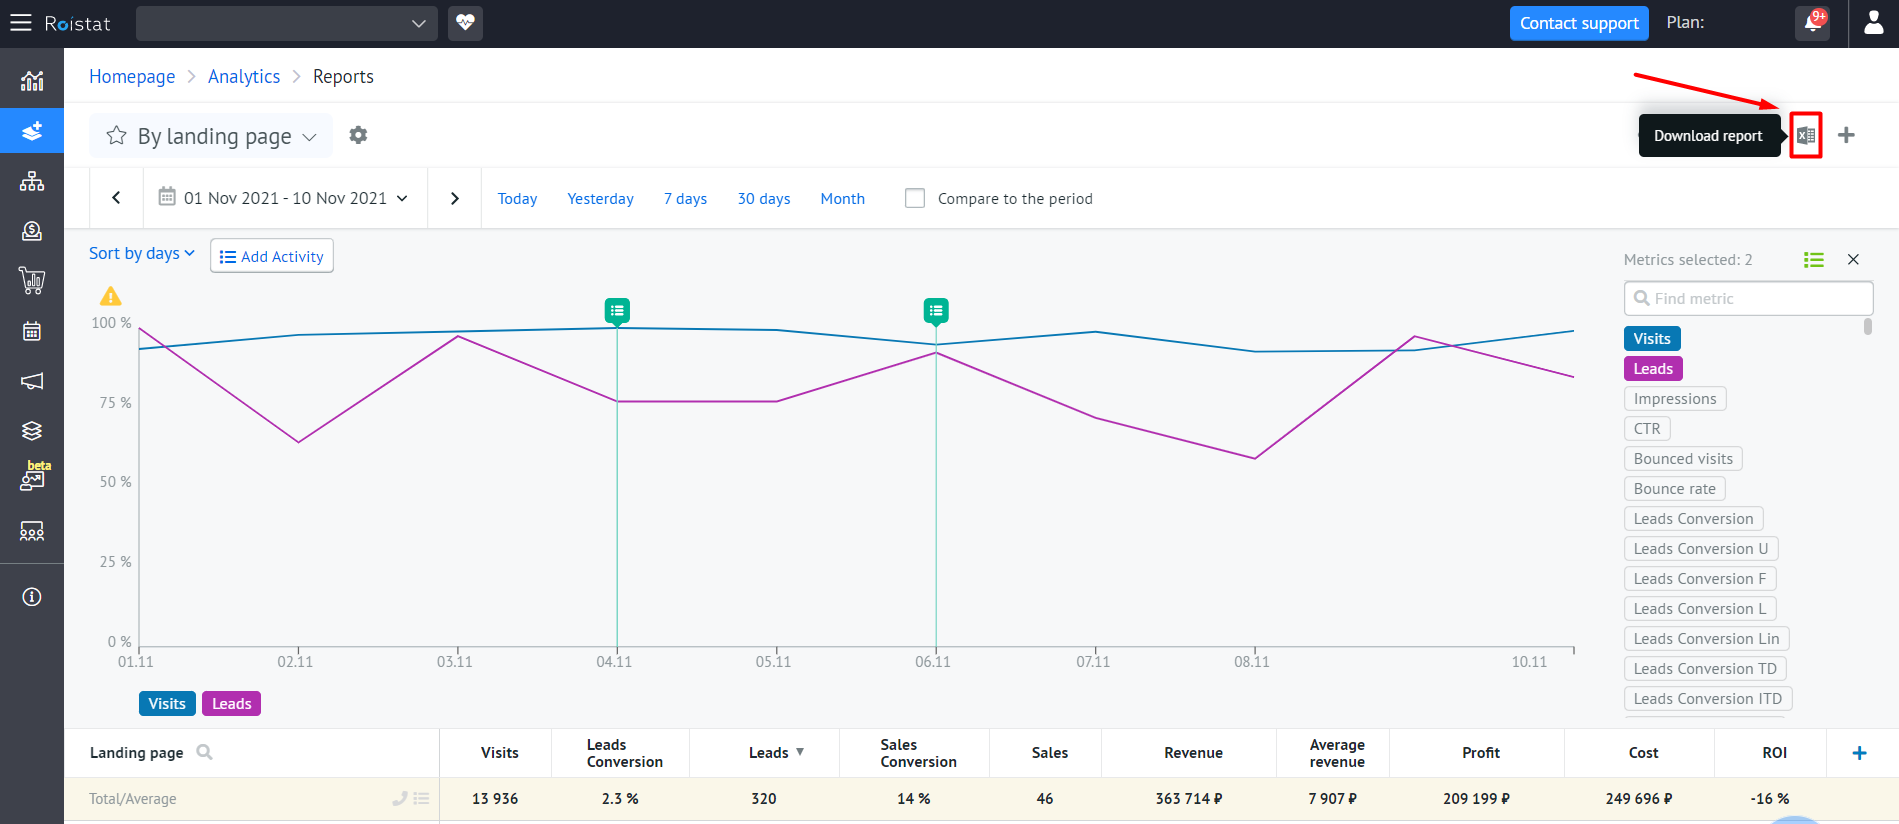
You can save reports to your computer in Microsoft Office Excel Sheet (.xls) format.
To do this, select the tab with the required report and click Download report in the upper right corner above the diagram:
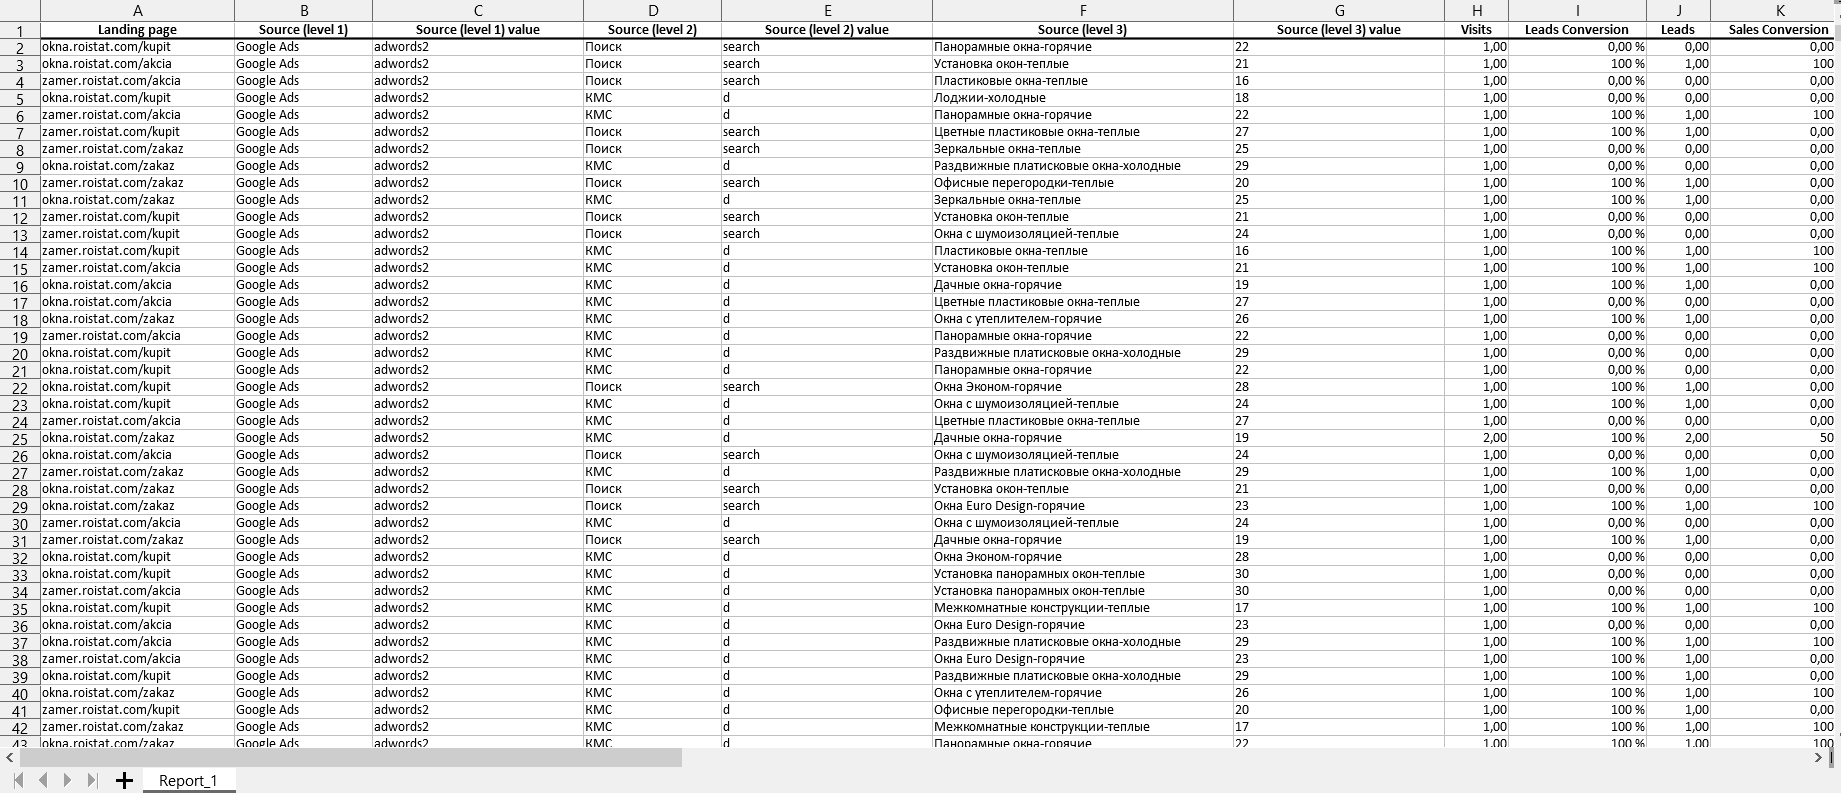
Excel spreadsheet example:
Please note:
If the report cannot be downloaded to a computer (for example, due to its size), it will be sent to the email of the user who clicked the Download report button.
Additional Report Settings
To choose which data to display in Analytics reports, use Custom metrics.
Favorite Reports
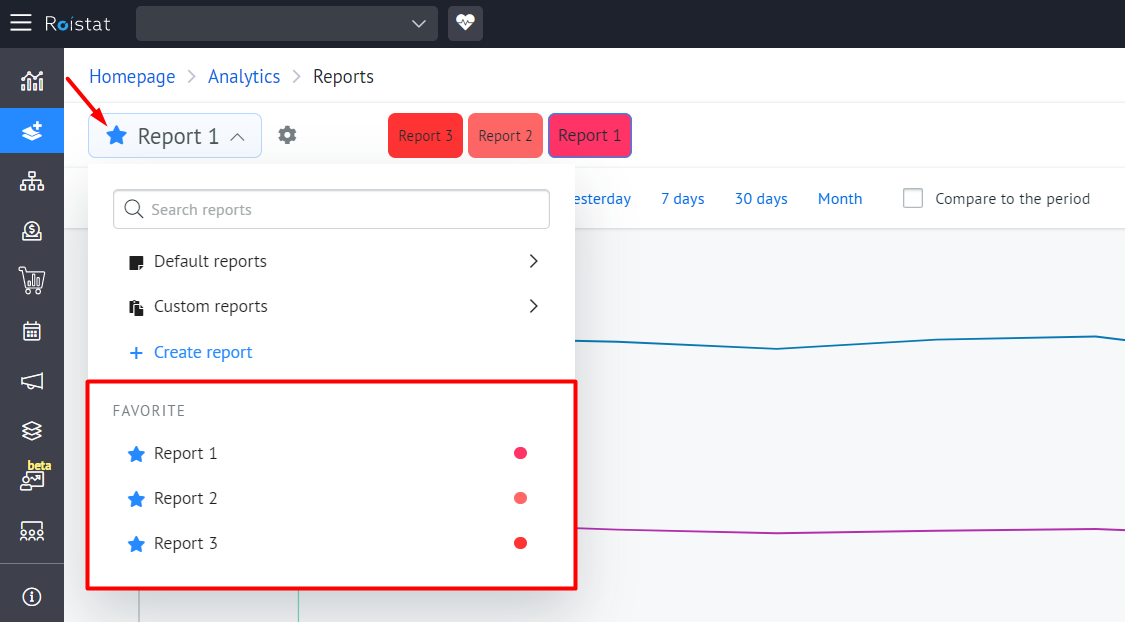
To have quick access to the most important reports, add them to the Favorite group by clicking on the star icon next to the report name:
Each user can set up reports individually for each project.
Data Filters
You can use only a certain part of the grouping data in the report. To do this, use special filters.
You can filter data by the same parameters that are used for creating groupings (see Step 2).
Click the Add filter button:
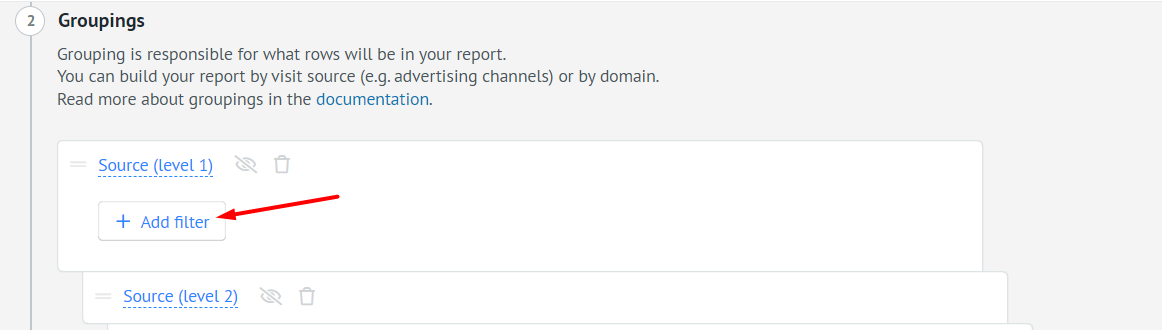
The filter is configured as follows:
Parameter + Comparison Operator + Parameter Value
The following comparison operators are available:
| Comparison Operator | Data type in the filter | Number of values in the filter | The parameter to filter by | Setting method |
|---|---|---|---|---|
| More | number* | 1 | ... strictly greater than the specified number | Manual input, for example: 5000 |
| Less | number | 1 | ... strictly less than the specified number | Manual input, for example: 1000 |
| Equals | number | 1 | ... completely matches the specified value | Manual input, for example: 100 |
| Equals | name** | 1 | ... completely matches the specified value | Selecting from a dropdown list |
| Is one of | name | 1 and more | ... matches one of the specified values. Example: if you set up a filter by country, specify the Is one of operator, and select Russia, Belarus, and Latvia, the report will show deals made in Russia, Belarus, and Latvia. For example, if you want to filter the report by dates from April 20 to April 24, you need to specify Any of and set the following values: 20.04, 21.04, 22.04, 23.04, 24.04. | Selecting from a dropdown list |
| Contains | name | 1 | ... contains the specified filter value | Example: if you set up a filter by country, specify the Contains operator, and select Belarus, the report will show the deals made in Belarus. You cannot use multiple "Contains" statements in the same filter. |
| Does not contain | name | 1 | ... does not contain the specified filter value | Example: you do business in Russia, Belarus, Lithuania, Latvia, and Estonia. If you set up the filter by country, specify the Does not contain operator, and select Belarus, the report will show deals made in all countries except Belarus. |
* Number is used only for business metrics and indicates the amount, sum of money, or percentage.
** Name is used for all other parameters in Analytics reports (for example, Source, Domain, roistat_param1).
Filters specific features:
- If there are several filters, there is always an "AND" operator between them. This means that the value must match the condition of each filter.
- Grouping filters are applied both for the current level and for all higher levels. That is, if you add a filter at the first level, it will be applied to all subsequent levels. For example, you set the utm_source grouping for the first level, where there may be various values: google, join_mail, yahoo_mail. For the second level, you set the utm_medium grouping and configured the filter: utm_medium + Equals + email. As a result, only join_mail and yahoo_mail will be displayed in the report as higher levels, since their utm_medium matches email.
- Filters by metrics apply only to the current level.
- After setting the filter by metric, the report displays only deals for which the value of this metric is in the top 5000 (the top is calculated by the number of visits). The rest is not included in the report. For example, there are 10,000 deals with different values of UTM tags. In the filter, you specified a metric value that is not in the top 5000. As a result, such transactions will not be taken into account in the report.
- If you set up the filter by deal statuses, you have to specify the status name, not its ID. If you rename a status added to a filter, the name will be automatically updated in the filter as well. If you remove a status from CRM and a project, it will not be automatically removed from the filter.
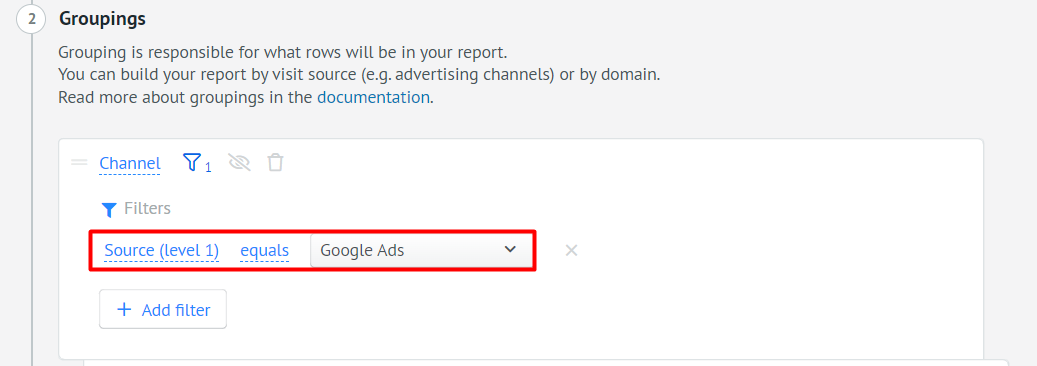
Example 1: making a report for Google Ads
For example, you want to see statistics only for the integrated Google Ads channel. Then you need to configure the filter as follows:
Source (level 1) + Equals + Google Ads:
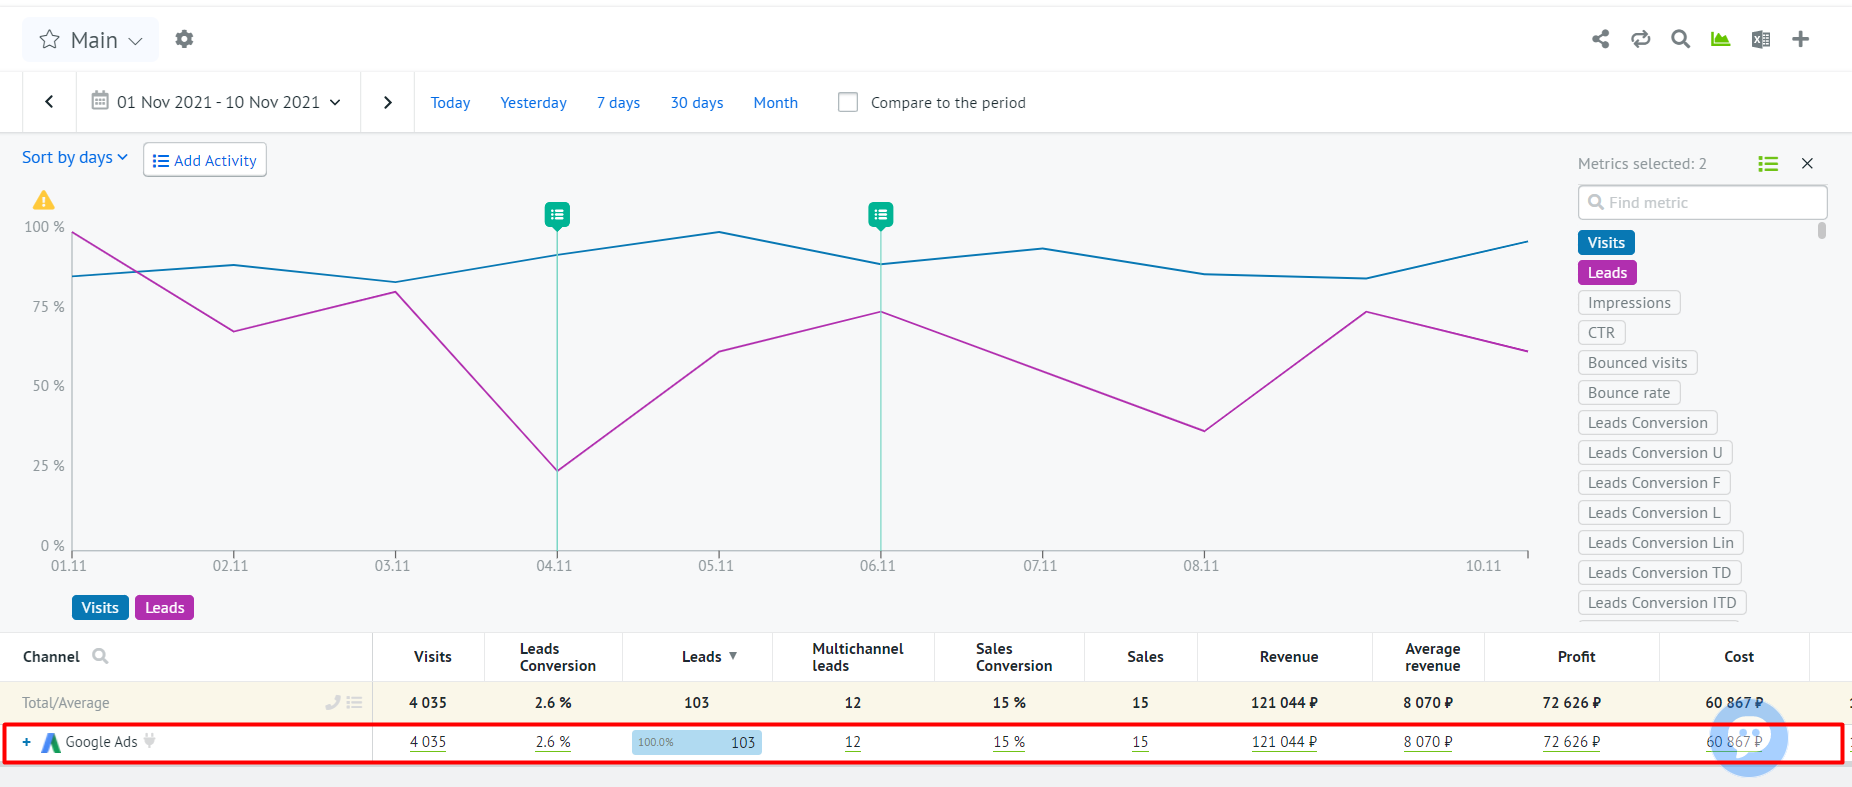
As a result, statistics will be displayed only for the Google Ads channel:
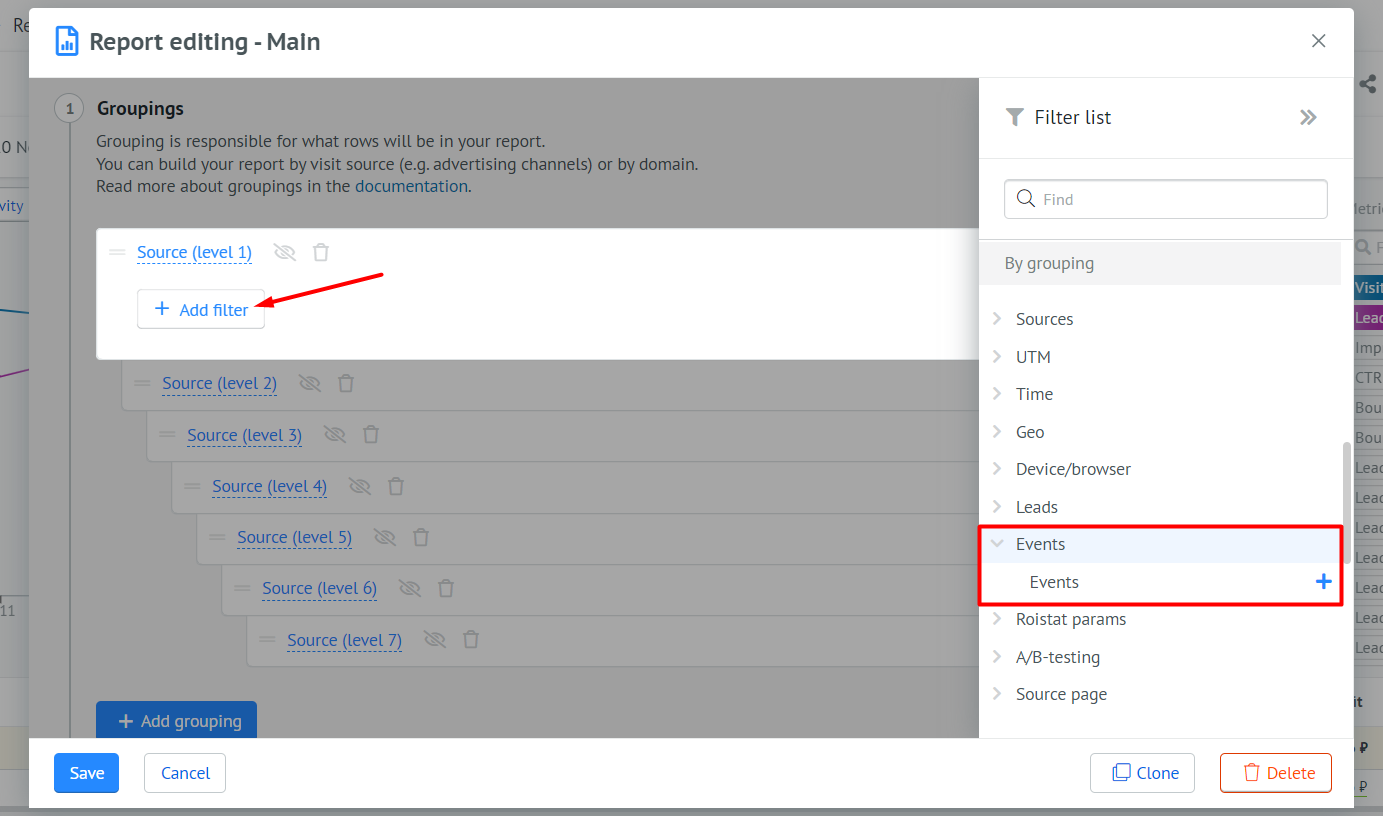
Example 2: making a report on visits that led to a specific event
For example, you set up an [event]((/features/events/about) on your website: Transition to product page. To view sales by visits for which this event triggered, you need to add a filter by event:
Then you need to specify the Equals condition and Transition to product page as the value:
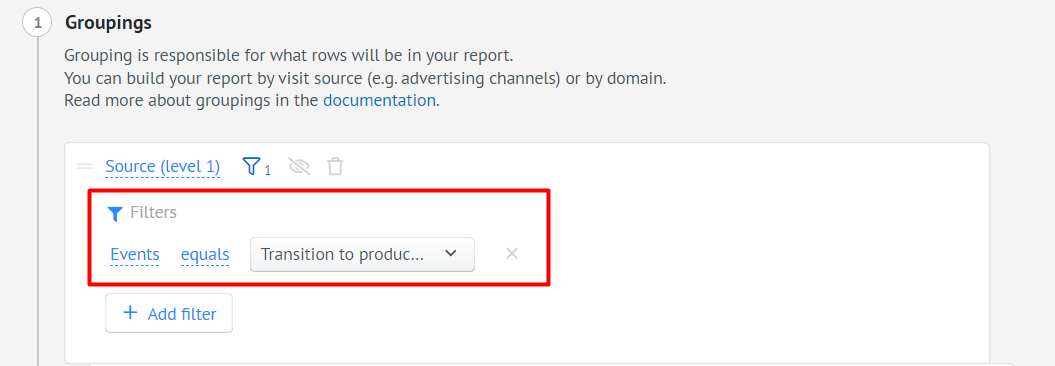
As a result, you will see data only for visits for which the event triggered.
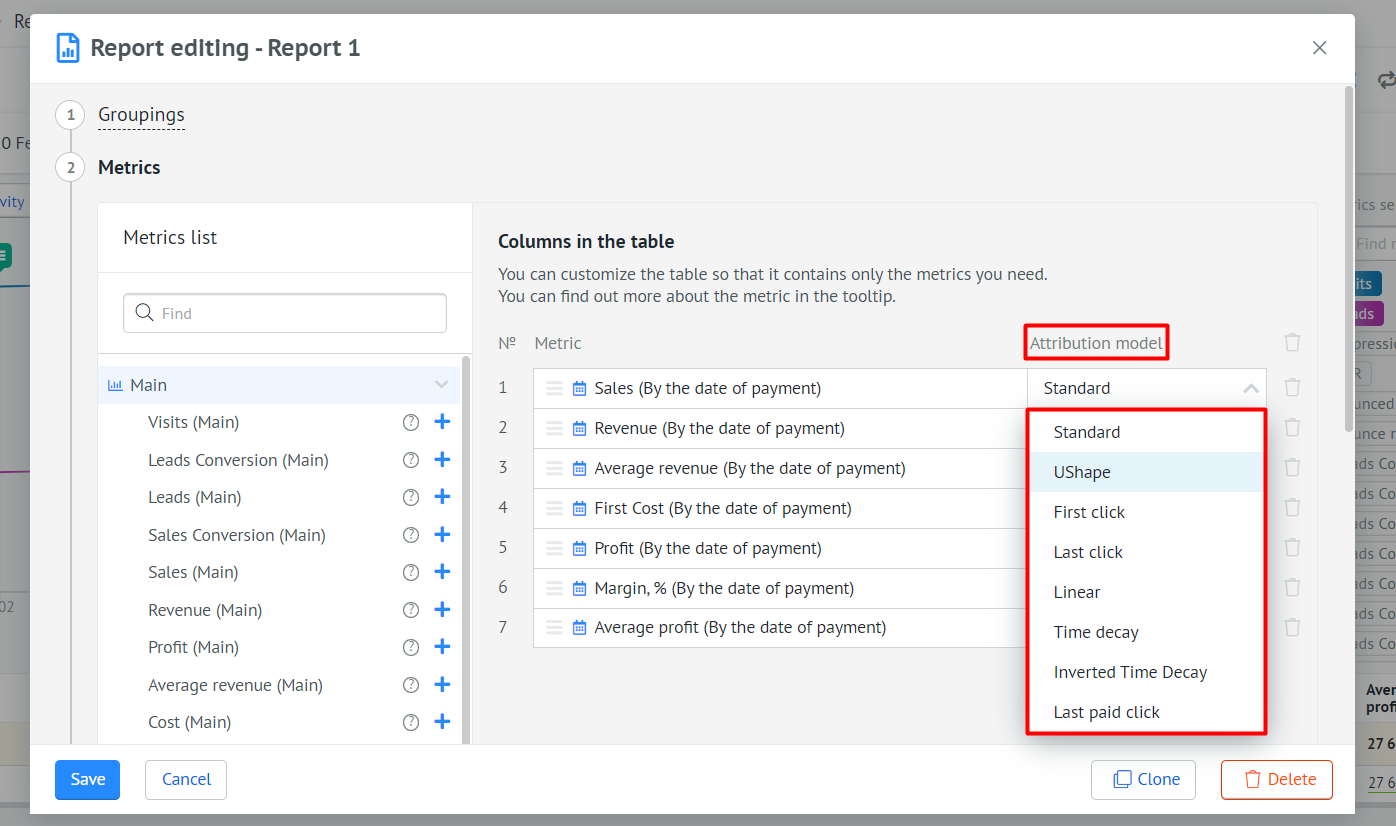
Attribution Models
Business metrics can be calculated using several attribution models: Standard, First click, Last click, UShape.
An attribution model is a set of rules that determines how the value of visits is distributed within the chain of visits. For more details, see the Attribution Models article.
You can select the attribution model when adding metrics to the report (Columns in the table). Select the necessary items from the drop-down menus in the Attribution model column:
Access to other users
The project owner can give other users access to the report and send them a link. At the same time, different employees can be given access to different reports. This can be useful if you want to show the deal details to your employee without giving them access to the entire project.
Please note:
Only the project owner can give access to the report by link.
To open public access to the report by link, click on the Share icon in the upper right corner and enable the Allow public access to the report option:
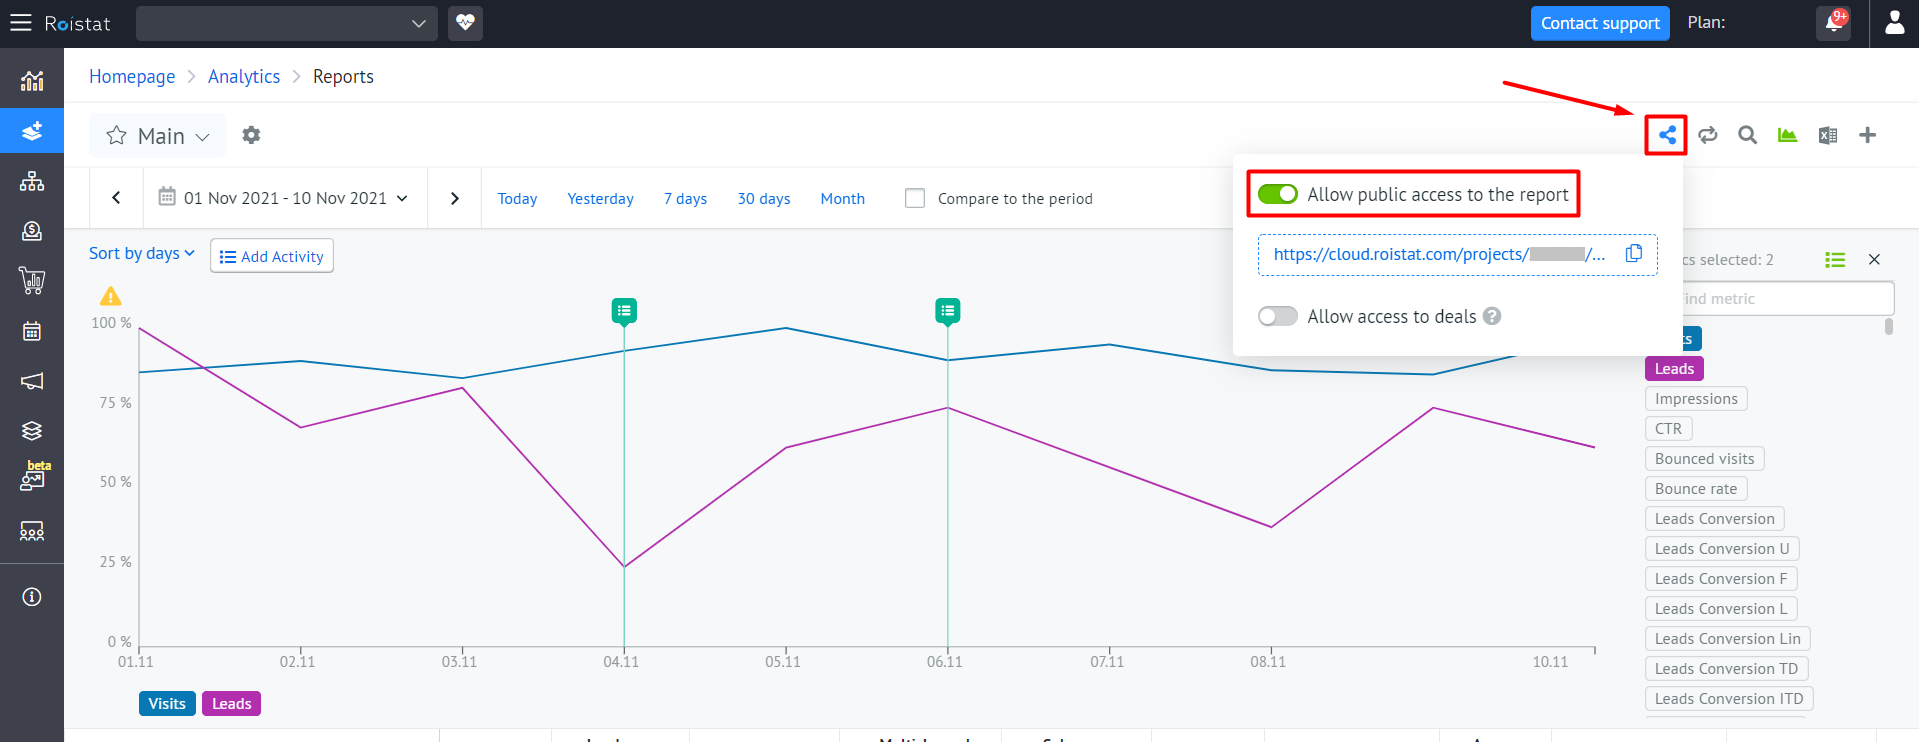
Only authorized Roistat users can view the report. They cannot change report settings, add metrics, or view the list of deals, but they can change the report period.
If necessary, you can open access to deals. To do this, click on the Share icon and enable the Allow access to deals option (it is only available if public access is enabled). In this case, other users will be able to view the list of deals and details for each deal.
If you need to revoke access, move the switch back. When enabled again, a new link to the report will be created.
Highlighting
Highlight reports with different colors for easy navigation in the list of reports:

To do this, go to the report settings in the Title and Access section. In the Color block, click on the square box and select the desired color in the palette or enter the HEX code in the input field:

Viewing Reports
View Control
After setting up the columns and levels of the report, you can proceed to managing the data in the table:
- Change the date range for statistics. The time period can be selected in the menu above the diagram.
- Show or hide channels with low visits. If the channel falls into the unpopular group, i.e. there are no leads from it, and the number of visits is less than 1%, it is not displayed in the table by default. If there is at least one such channel, you can customize its display using the link below the table: Show all channels or Hide channels with low visits.
Please note: if the roistat field in a deal is filled in manually (for example, for offline sources), the name of the entered advertising channel is displayed in lower case in the report table. For example, if you add the value ROI to the roistat field, in Roistat report it will be displayed as roi.
Period Comparison
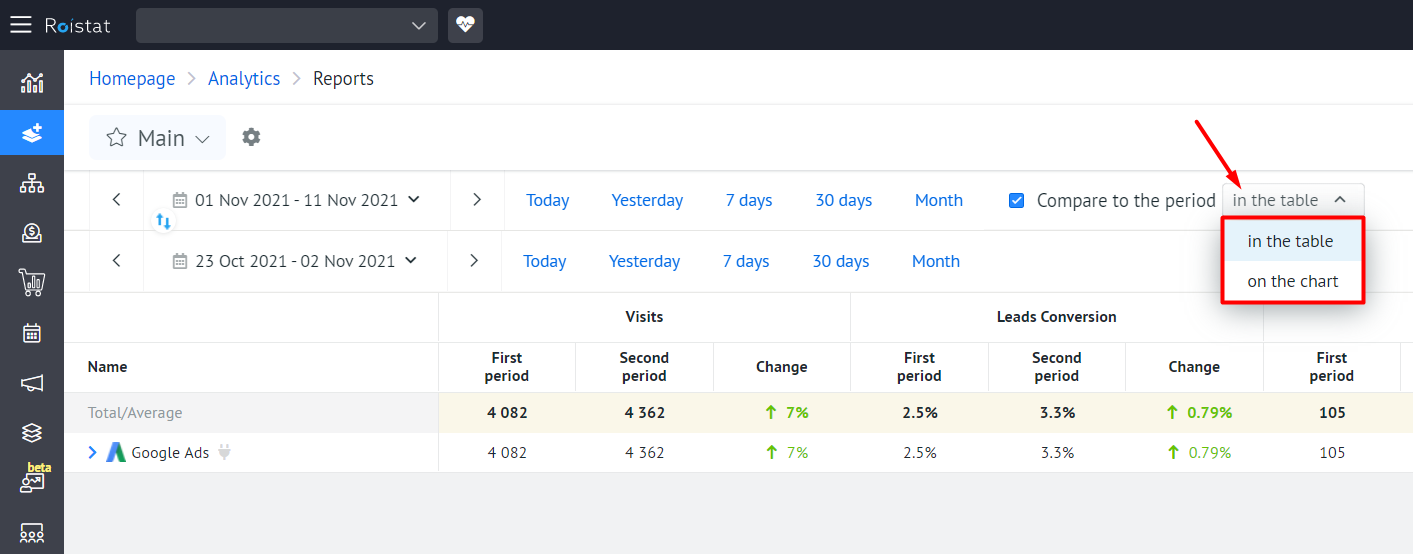
You can compare statistics for different periods. To do this, go to the Reports section, check the box next to the Compare to the period option and specify two periods:
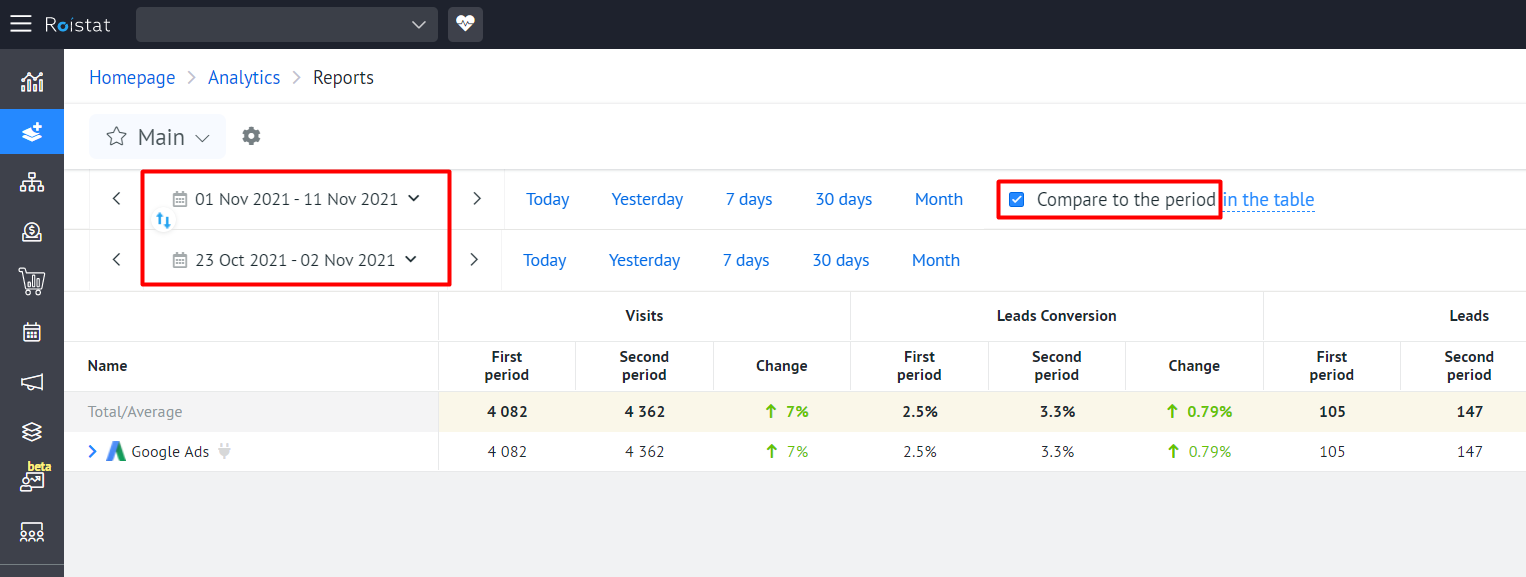
The selected periods will be shown as a table or chart, depending on the option selected:
Period data is displayed by metrics (Visits, Leads Conversion, Leads, etc.). Each metric has three columns: First Period, Second Period, and Change. For convenience, the positive dynamics are highlighted in green, and the negative ones are highlighted in red:
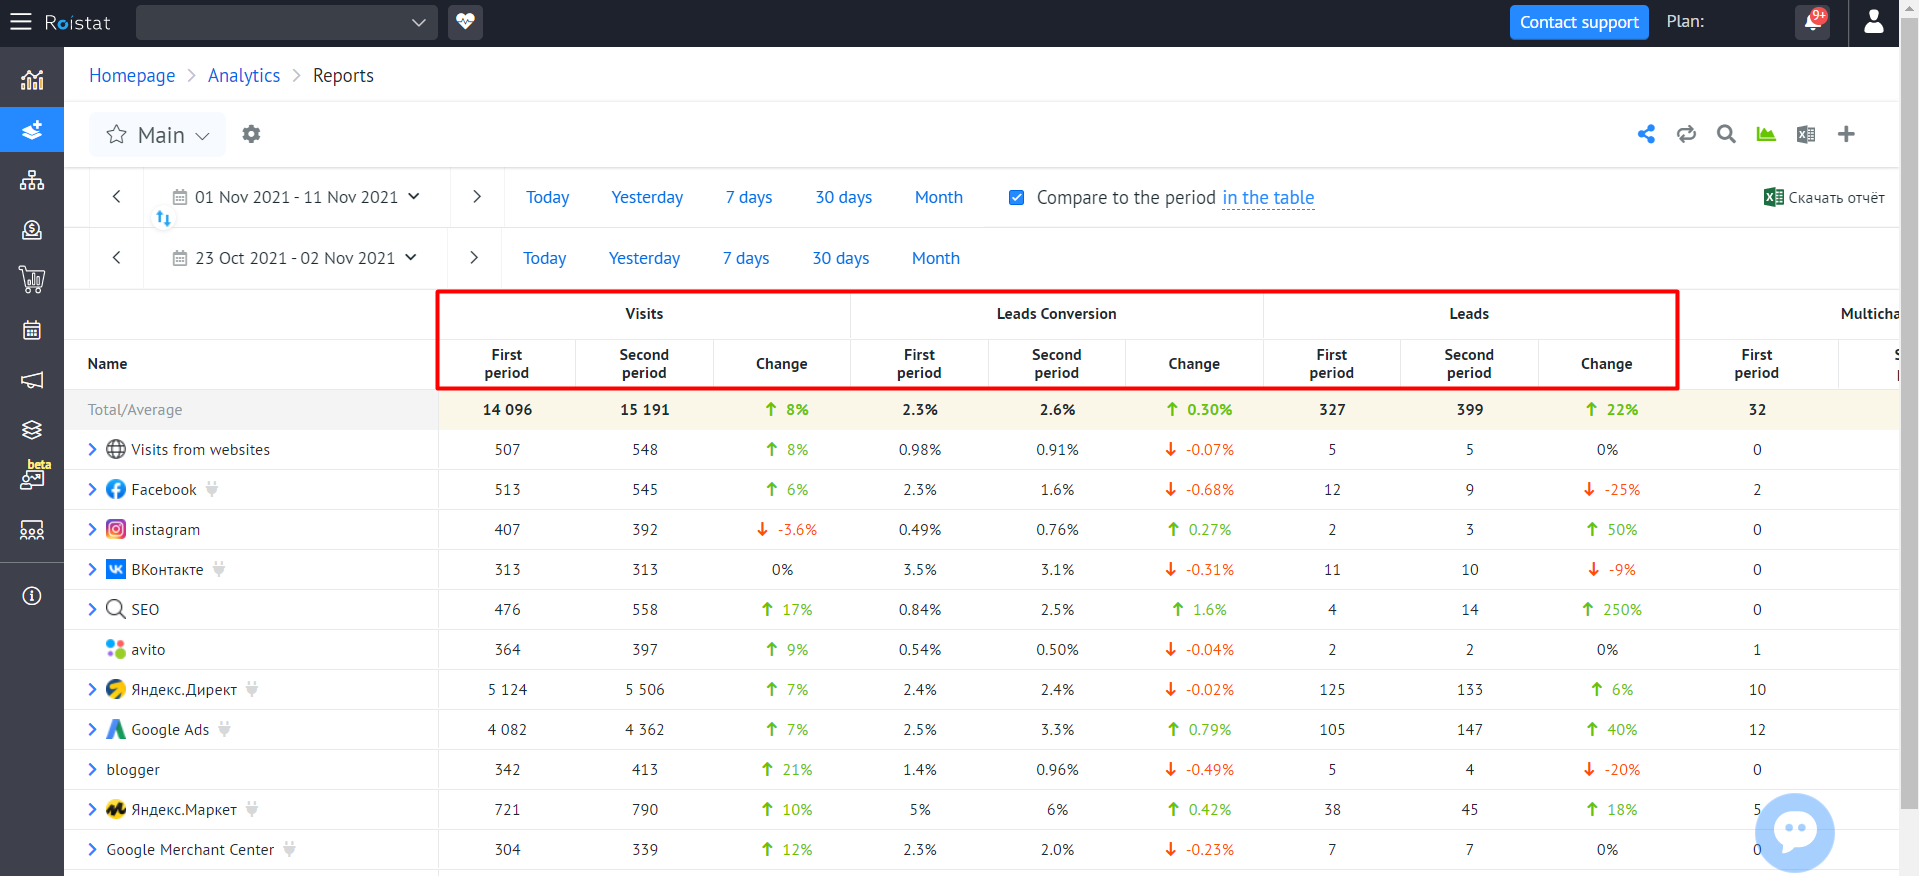
The result in the Change column is calculated as the difference between the two compared periods. For example, if there were 100 visits in the first period and 95 in the other period, you would see the value 5 in the Changes column.
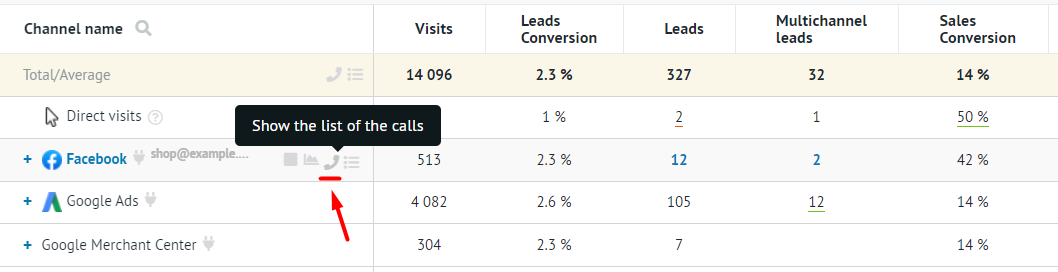
View Calls for Each Advertising Channel
In the list of calls for an advertising channel, you can click on a specific call and listen to it. To go to the list of calls, click on the phone icon in the column with the name of the advertising channel:
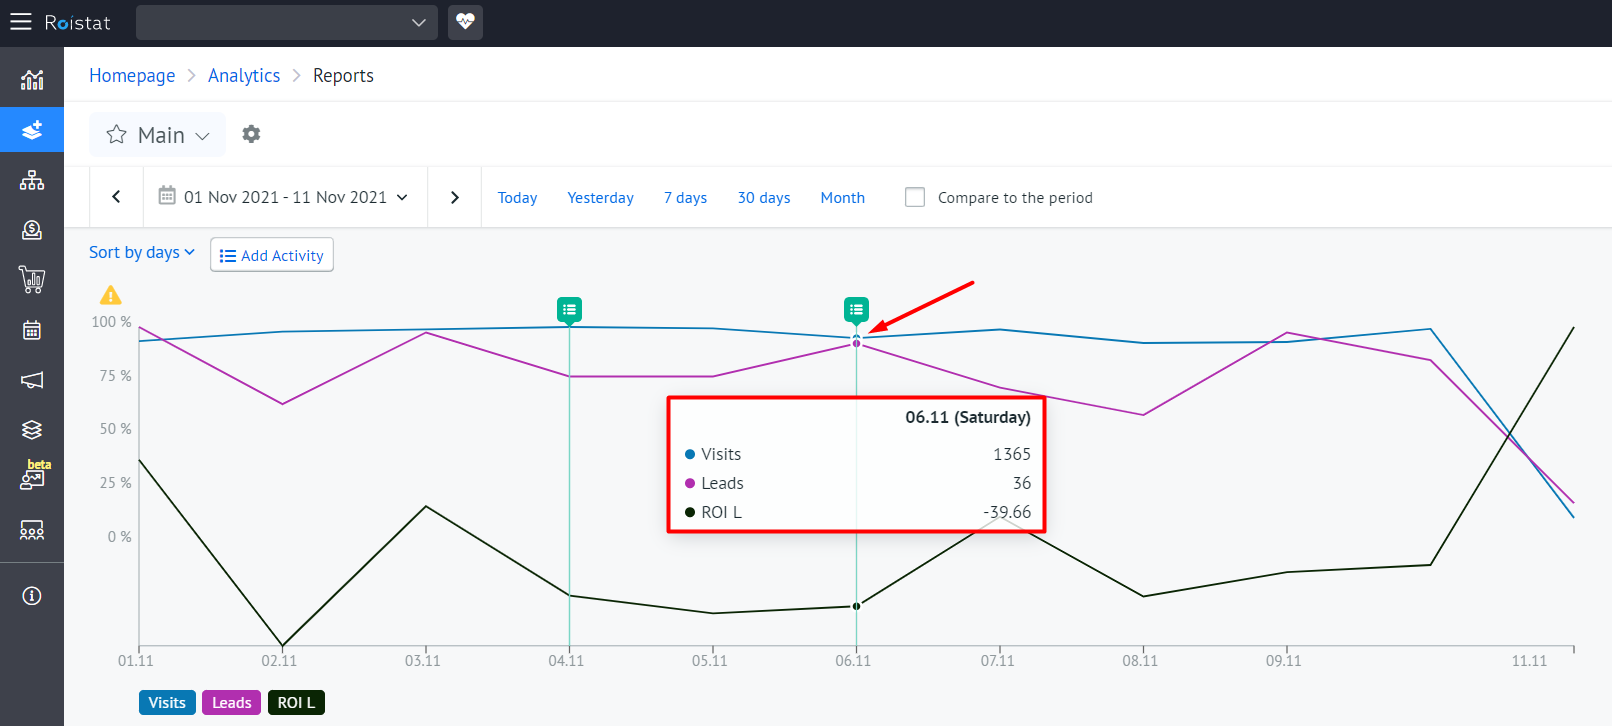
Diagrams of Changes in Metrics
Diagrams allow you to visualize your data, track and compare changes in various business metrics. Hover over the diagram, and it will immediately display the values of all configured metrics for a specific day of the month:
Report Limitations
Limitations of the Deal Status Report
Reports with the Deal status grouping display only those statuses that contain at least one deal. For example, CRM has the following statuses: New, In progress, Agreement, Awaiting payment, Paid. There are deals only in New, In Progress and Paid statuses. In the Analytics report, you will see statistics for New, In Progress and Paid statuses, while Agreement and Awaiting payment statuses will not be displayed.
Limitations when Calculating Metrics
VAT, Commission, and Discount from the advertising channel settings (Integrations → Ad Channel → Advanced Settings) are taken into account only in reports grouped by advertising channel.
Limitations when the Plan is Not Paid
Statistics in reports is available only for paid periods, with the exception of the trial period, when there are no restrictions on viewing reports.
What does it mean? Let's say today is June 10th, and you had a trial period from April 17 to April 30. Then you paid for May. If you select the period from April 17 to May 31, the report will be available. However, if you select the period from April 17 to June 10, you will see the message asking you to pay for the selected period. Click Pay to proceed (you will be taken to the Balance and Plan section).
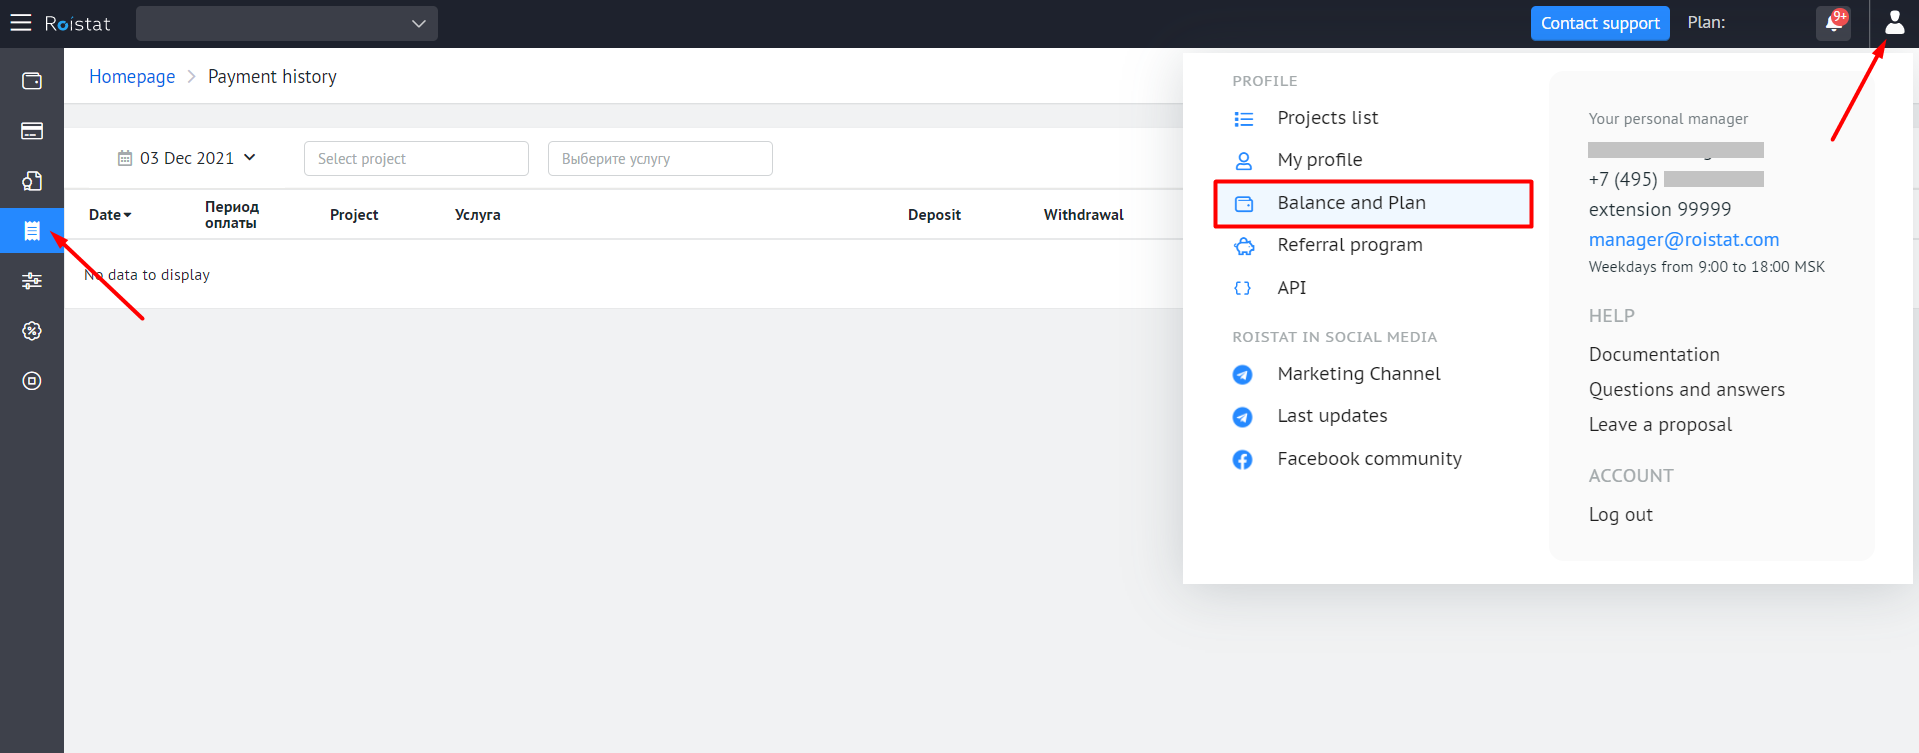
In the Balance and Plan → Payment history section, you can see on which days there were no plan charges:
Editing and Deleting a Report
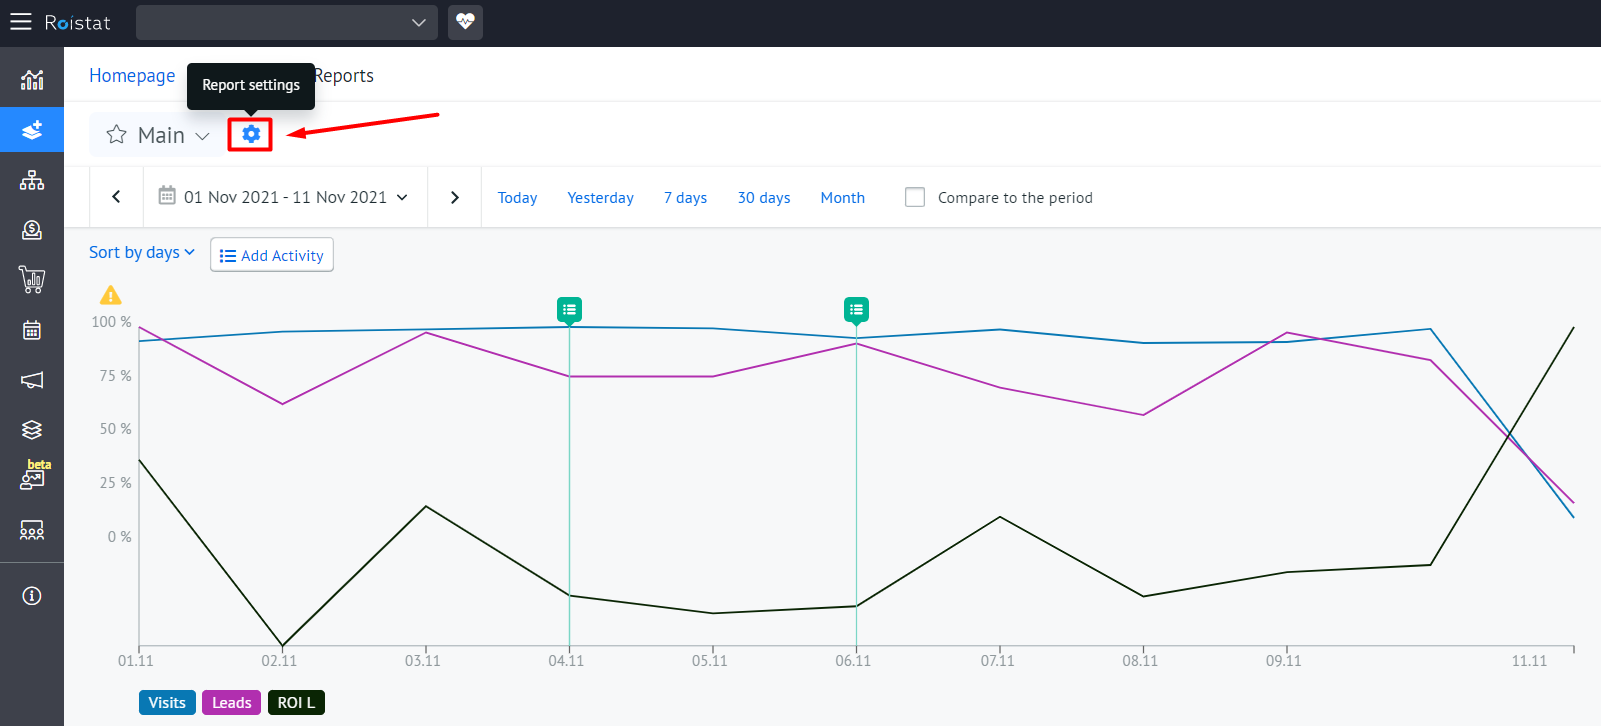
To edit the report, click on the gear icon:
Click Save to save your changes. Please note that you cannot save changes to a default report, but you can make the necessary edits to it and save the result as a copy of the default report.
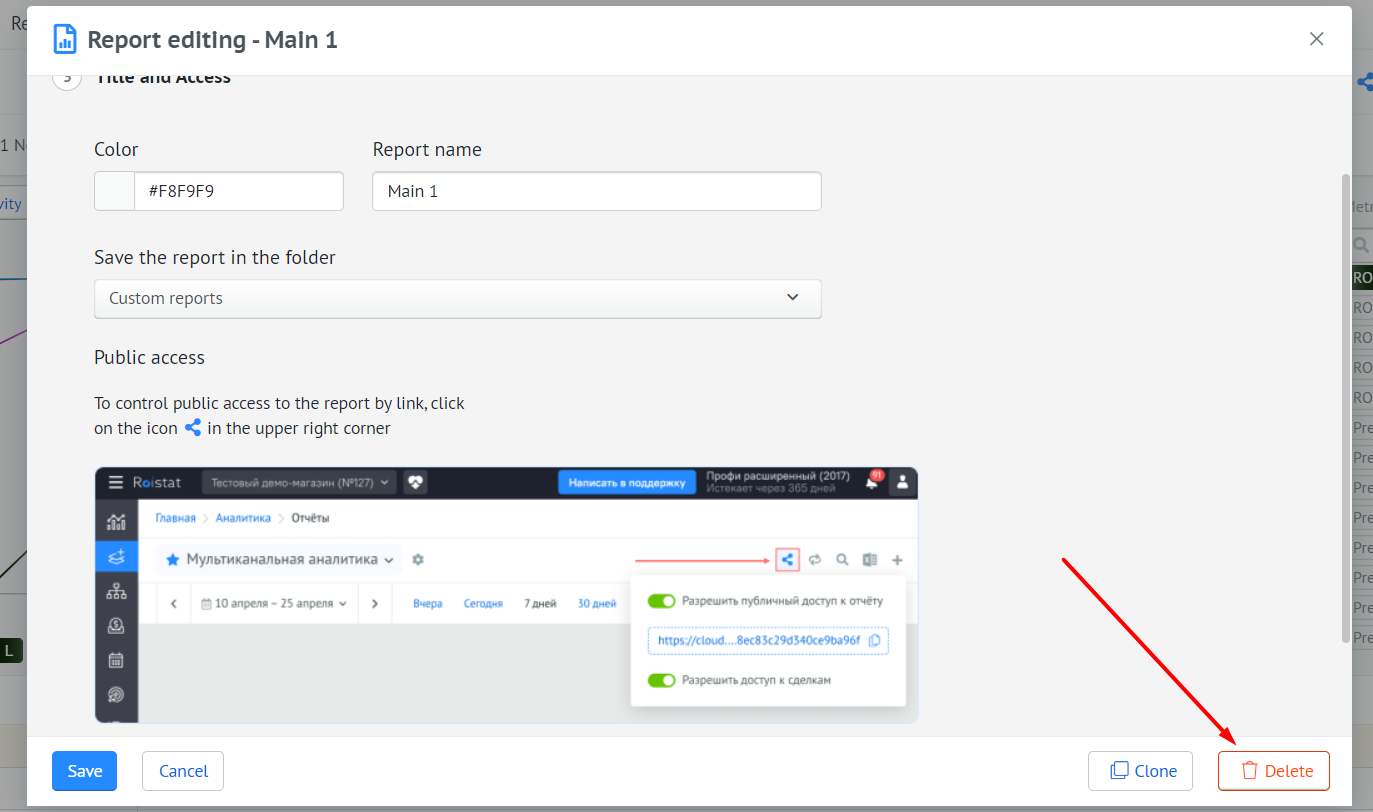
To delete a report, go to the report settings and click the Delete button:
You cannot delete a default report.