Grouping Leads by Sale Date
By default, the Analytics report is based on the lead creation date: the report displays leads created during the period specified in the report settings.
Sale date is the date when the lead was first uploaded to Roistat in the status from the Paid group. If for some reason the lead with the Paid status is not loaded on time, Roistat will not display the sale.
The report grouped by sale date includes leads with statuses from the Paid group, which were paid within the time period selected in the report settings. Such a report is useful for analyzing sales for a selected period of time, and only sales related metrics are available in it.
How to use custom field to upload sale date
You can use custom sale date field to set the sale date in Roistat analytics. In this case, specify its name in the experimental feature called The name of the field from which you want to load the sales date:
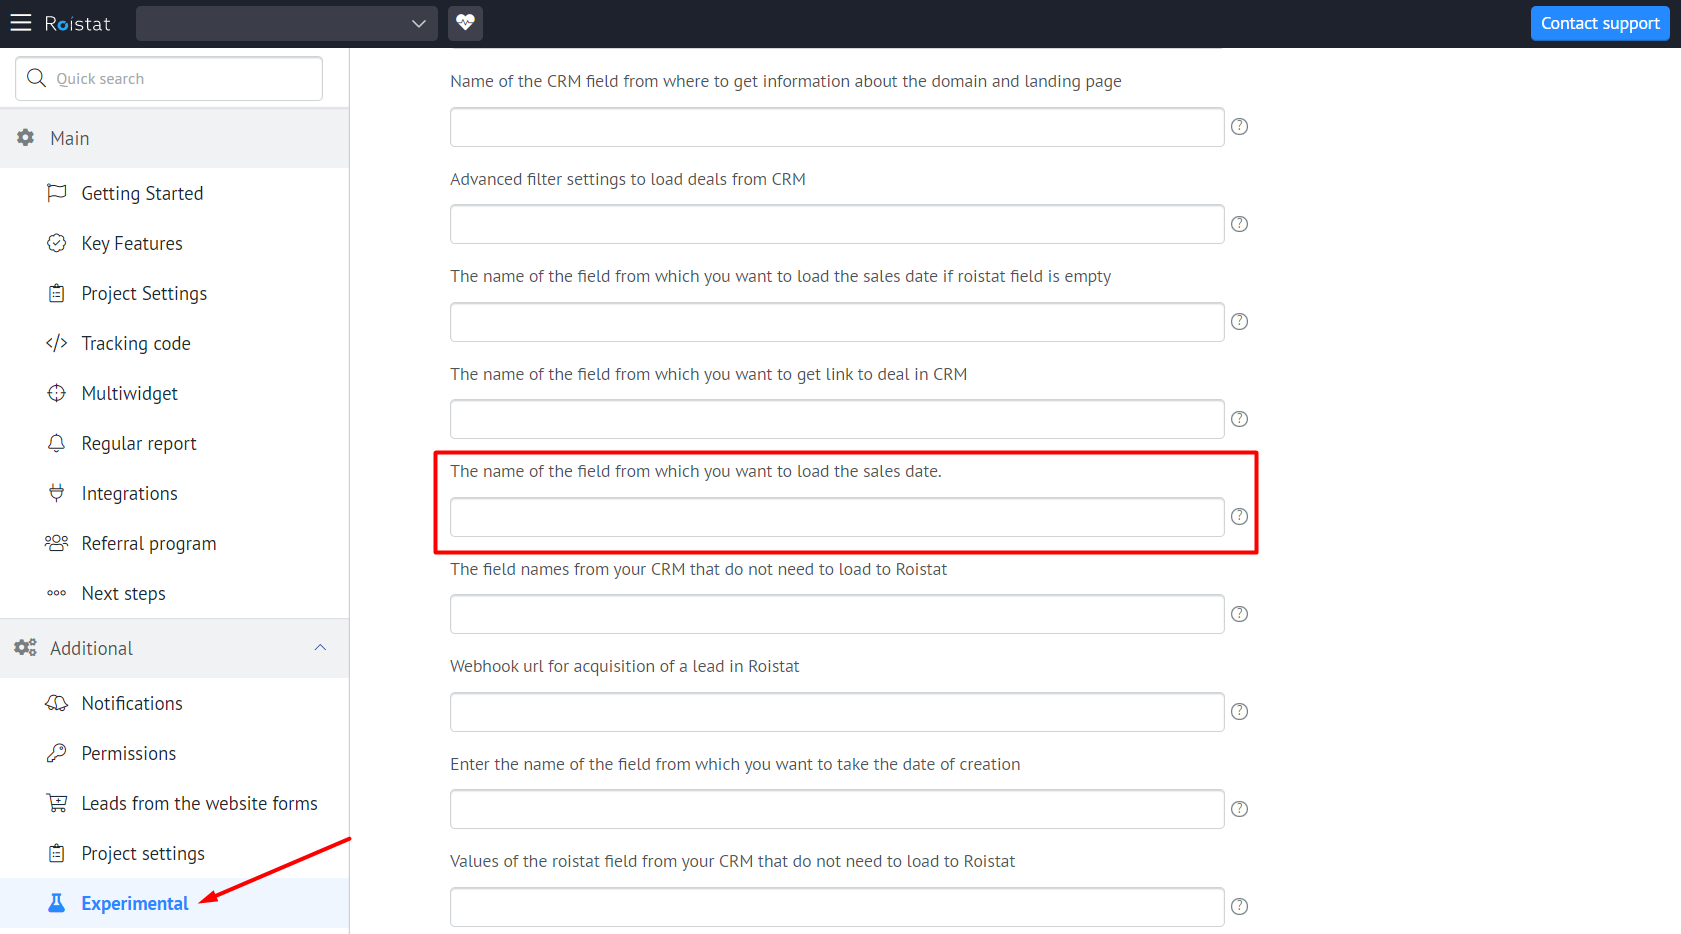
The field must contain a value in the YYYY-MM-DD HH-MM-SS or Timestamp format.
Please note:
- Roistat reports show dates of sales made since mid-February 2018.
- If the sale date of the uploaded lead precedes the date of its creation, Roistat will change the creation date to match the sale date. As a result, the deal cycle will be equal to 0. If you want to keep the original lead creation date, please contact support.
Setting the Sale Date Grouping
To build a report grouped by sale date:
-
In the Analytics section, click on the settings icon for the desired report:
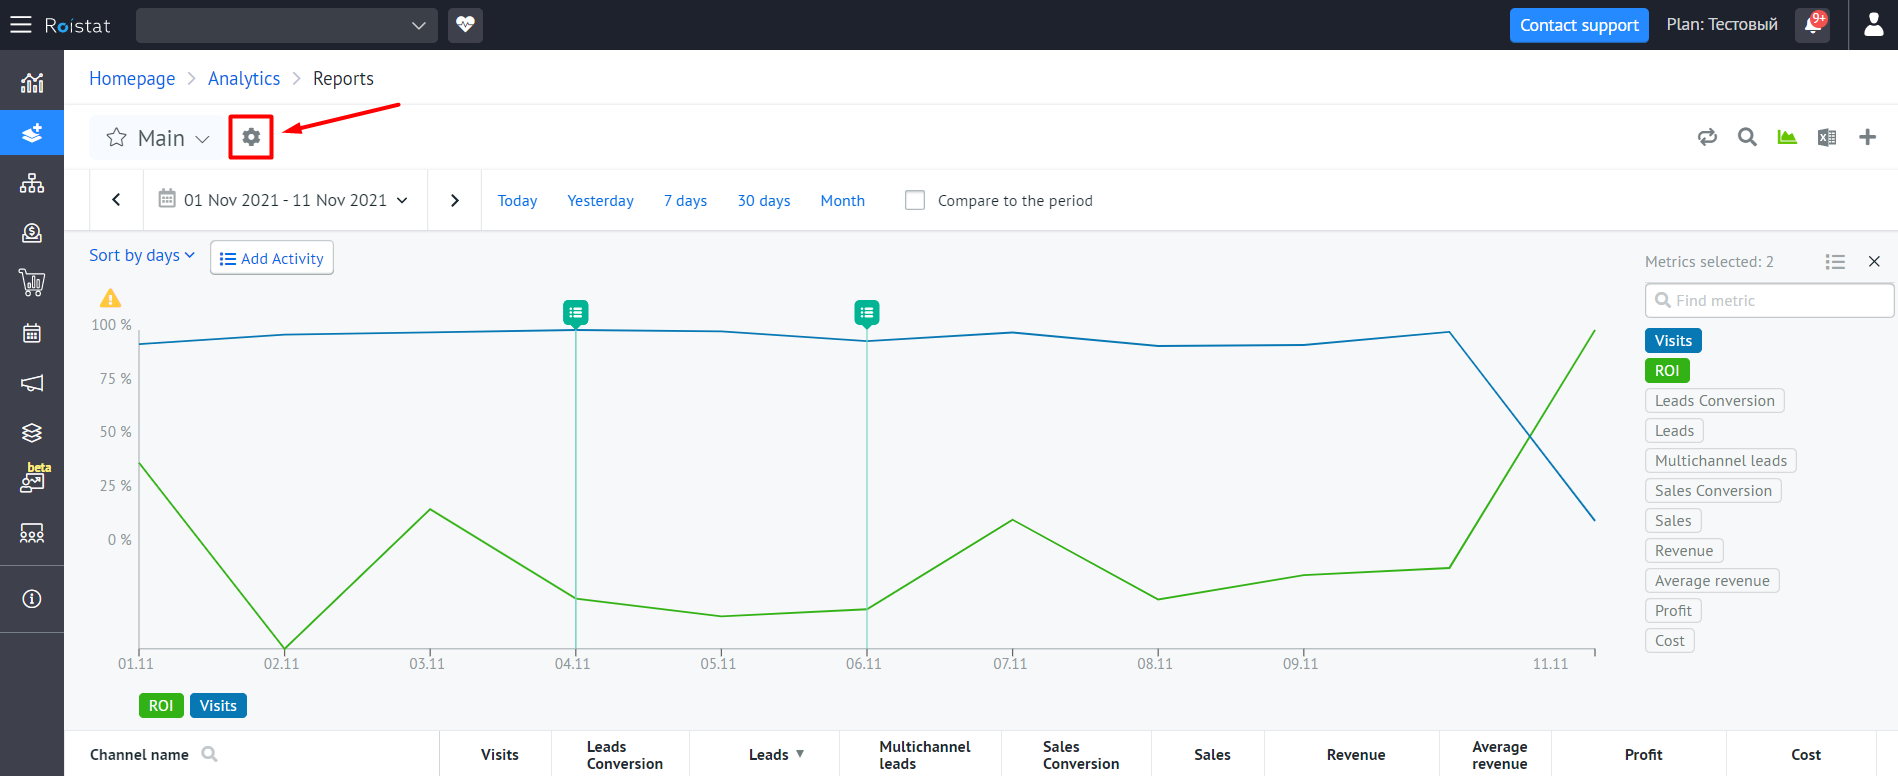
The report settings window will open.
-
In the Metrics section, click Advanced settings under the list of indicators:
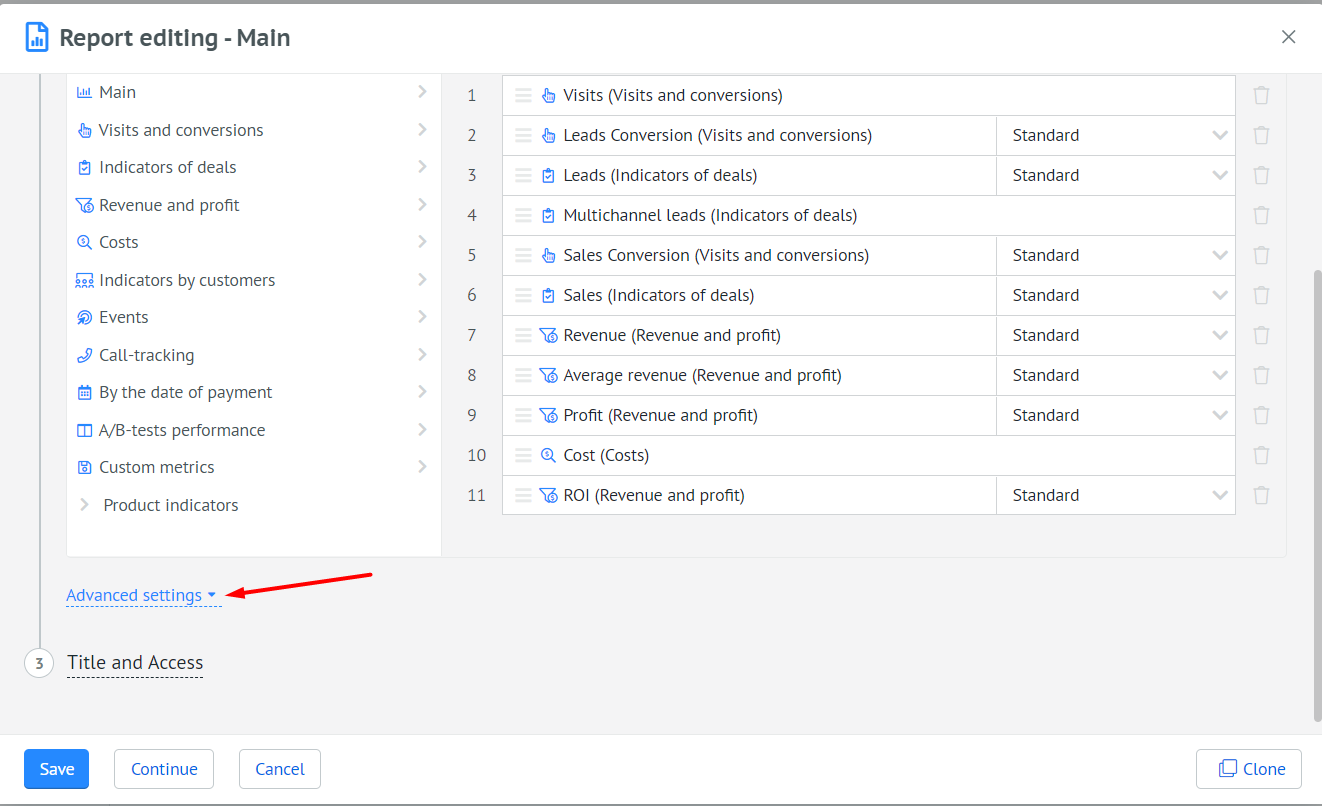
-
In the Group the leads by drop-down list, select Sale date:
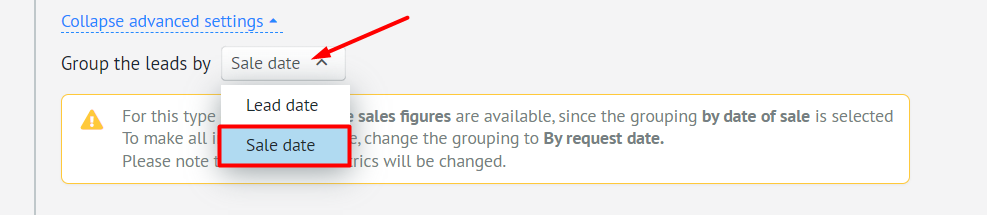
Please note:
Only sales related metrics are available for reports grouped by sale date. To see other metrics, group the report by lead date.
-
Click Save.
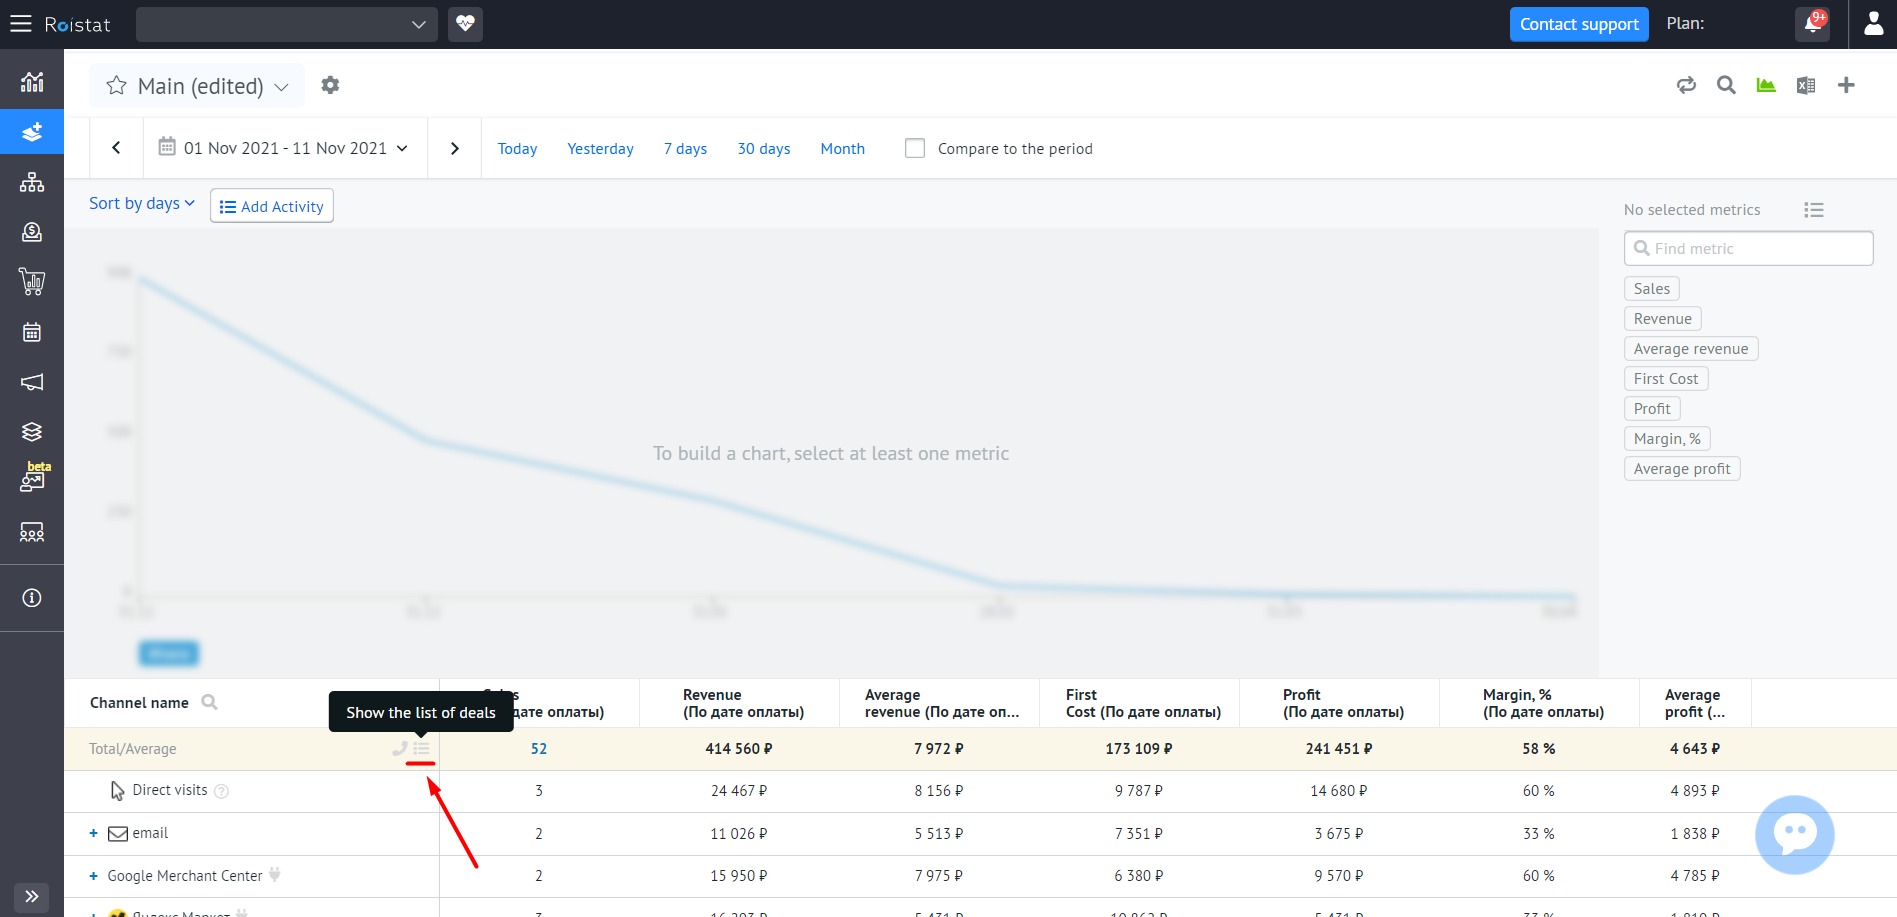
Sale date can be displayed in the list of deals. To add a Sale Date column to the table:
-
Click Show the list of deals in the table:
-
In the upper right corner of the window with the list of deals, click on the settings icon:
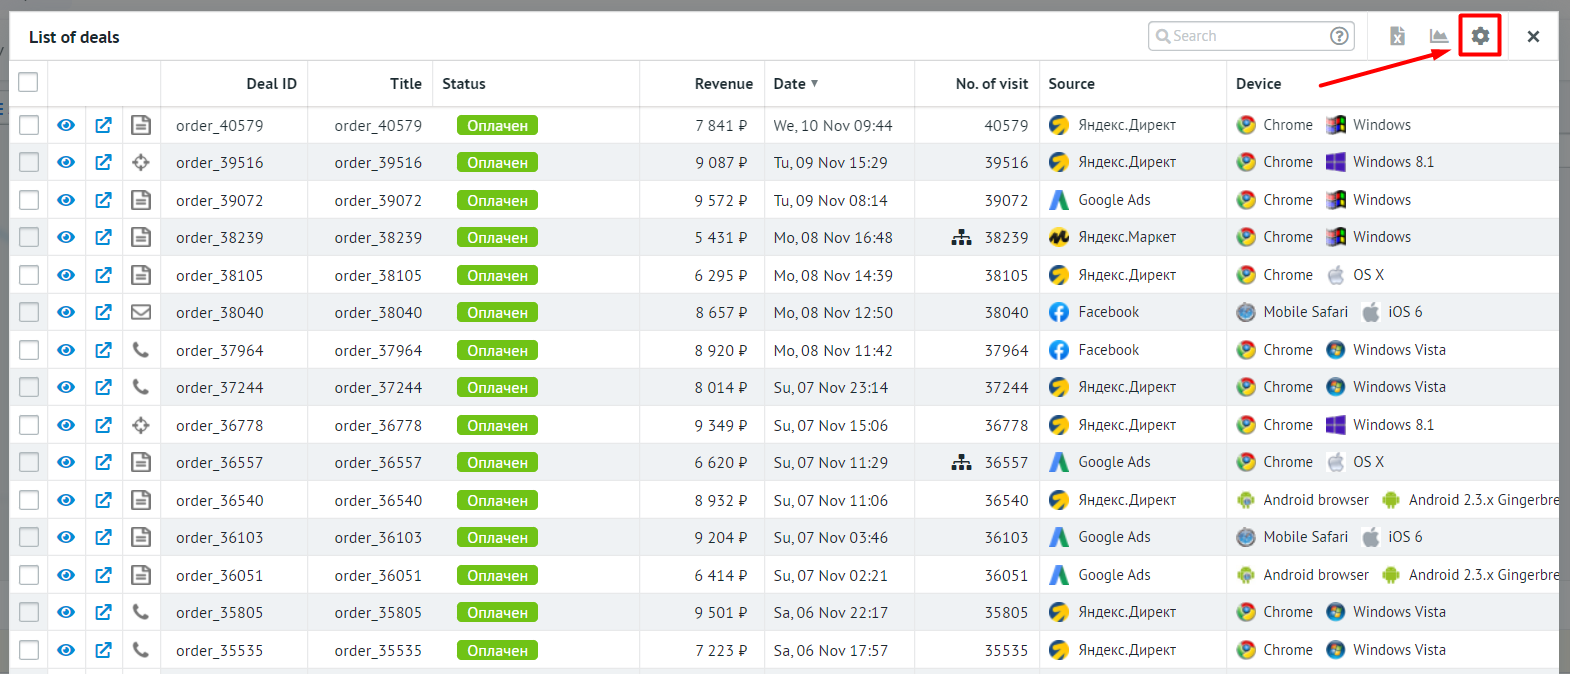
The Deal list configuration window will open.
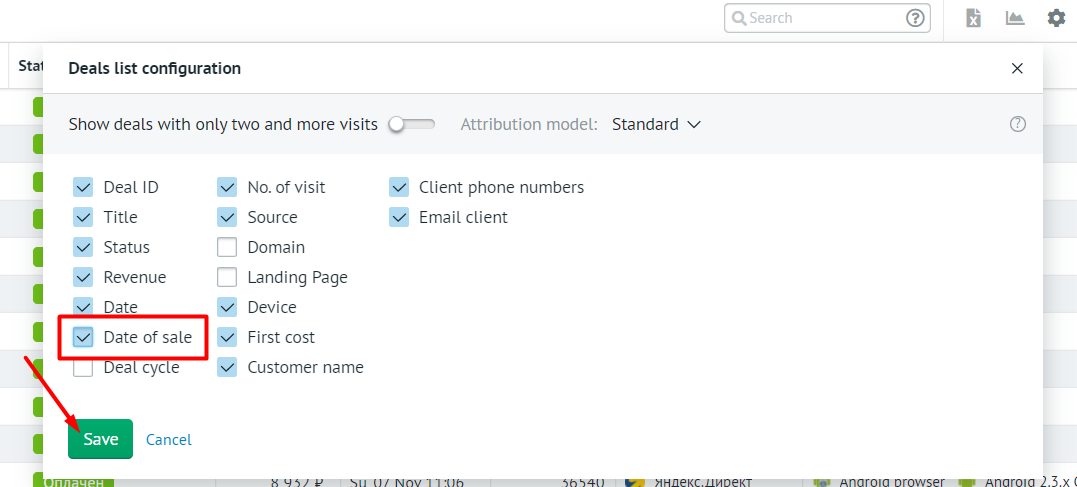
-
Check the box next to the Date of sale option and click Save:
Average Deal Cycle
The deal cycle is the period between the deal creation date and the sale date, expressed in days. The Average deal cycle metric is available in the main Analytics table and in the table with the list of deals.
To add the Average deal cycle column to the Analytics table:
-
In the Analytics section, click on the settings icon for the desired report:
The report settings window will open.
-
Go to the Metrics section. In the Indicators of deals block, click the plus icon next to Average deal cycle:
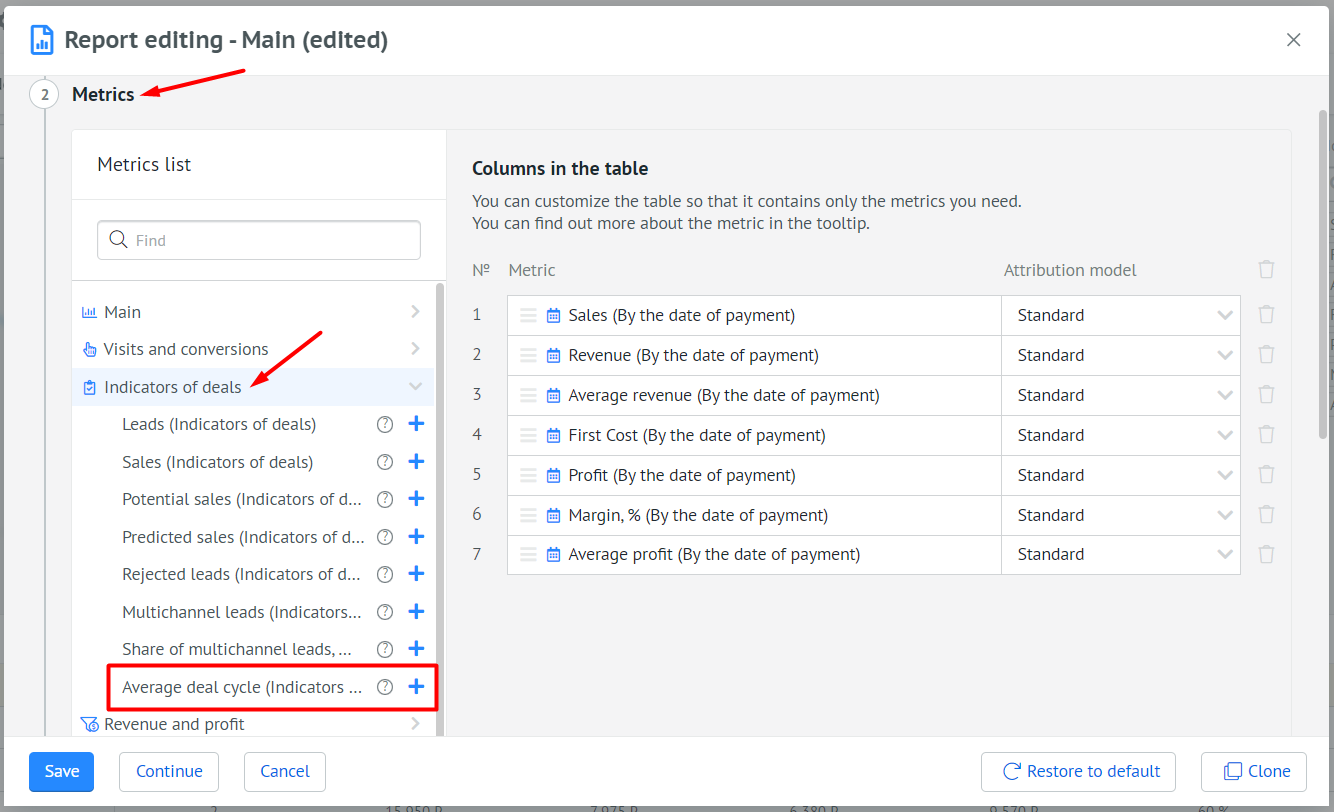
-
Click Save.
To add the Average deal cycle column to the table, use the instruction for the Sale date column in the previous section of the article.