Custom Metrics
Description
With Custom metrics, you can:
- Analyze the effectiveness of advertising sources based on additional data;
- Carry out marketing planning: create plans and track them, increasing business efficiency;
- Calculate the exact ROI of the channel, taking into account additional costs.
Setting Up
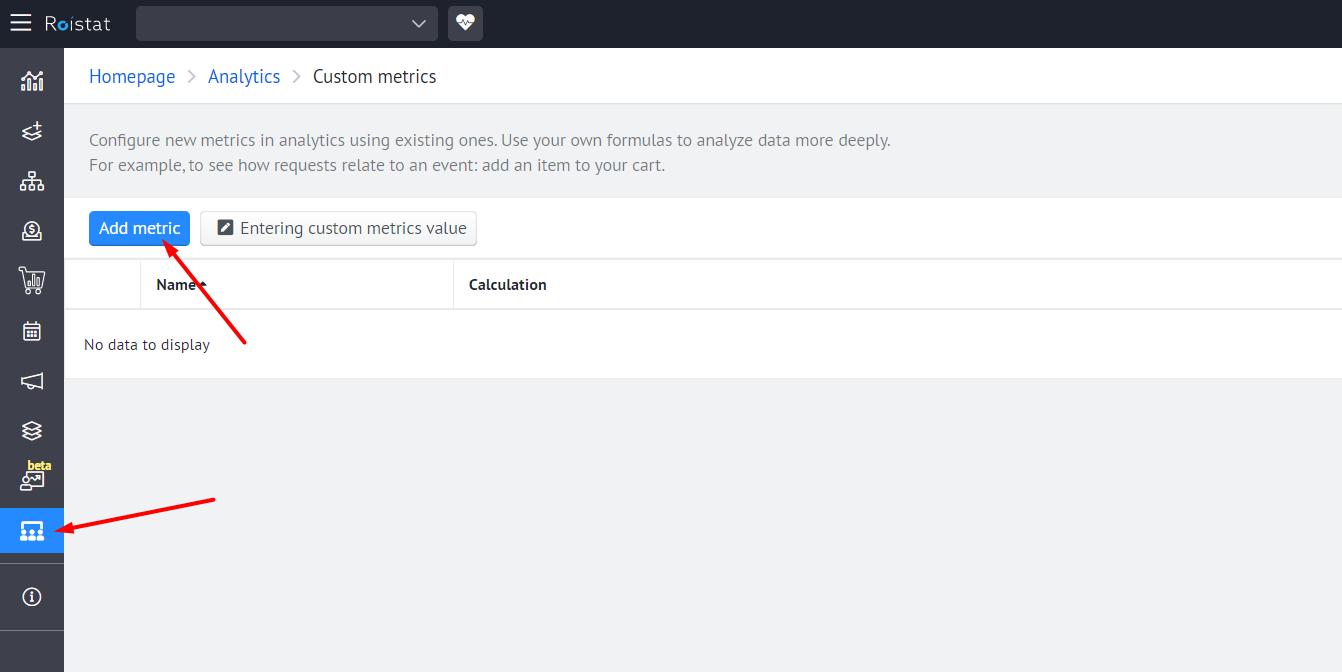
To add a custom metric, go to Analytics → Custom metrics → Add metric:
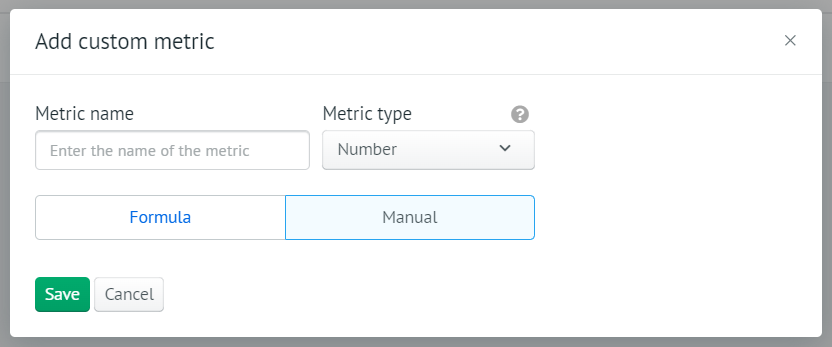
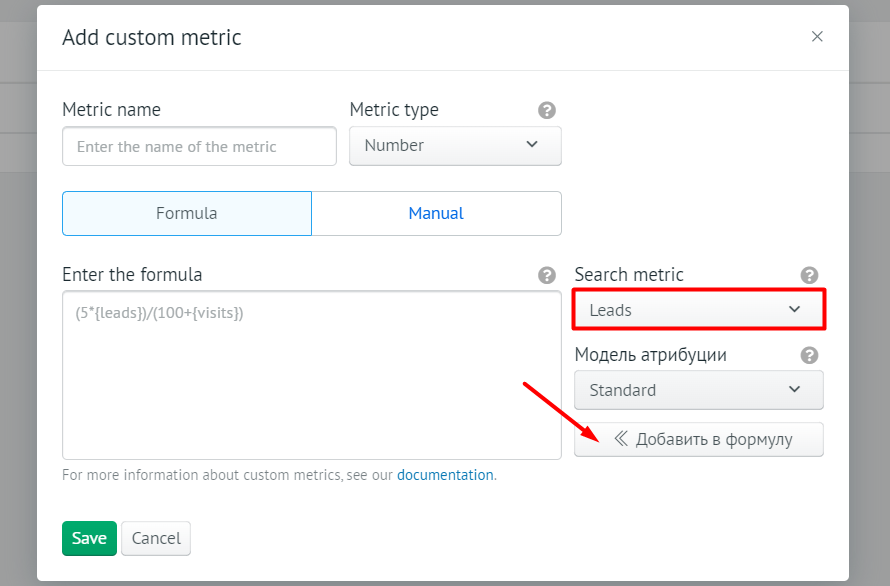
In the window that opens, enter the name of the metric and select the data you are interested in.
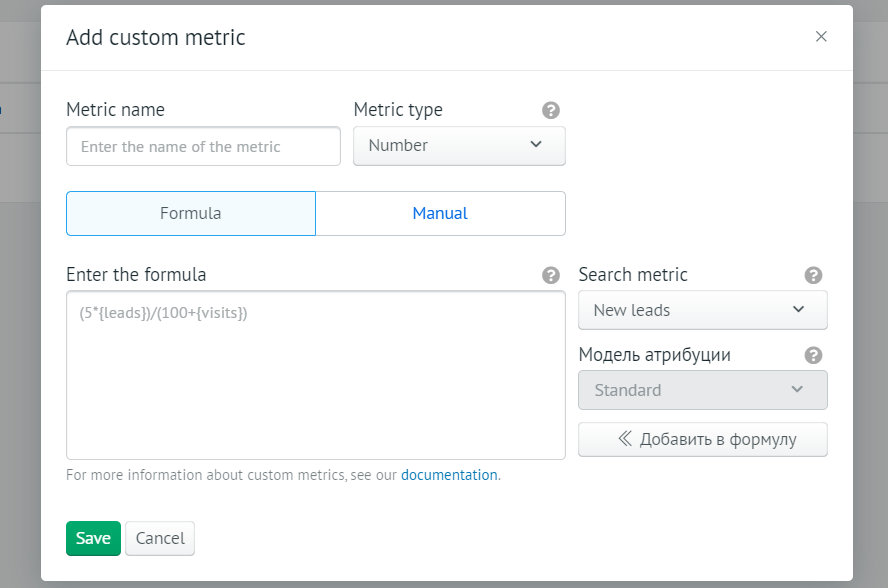
Metric Name
This name will be used in analytics reports. Choose a name that makes it clear what information your metric contains.
Metric Type
The metric type affects how data is displayed in analytics reports. The following types are available for selection:
-
Number. Displayed in reports without additional calculations.
-
Percent. Percentages are added to reports. Use this type for relative values. It is only available for metrics calculated by the formula.

-
Money. Project currency is added to reports. Use this type for monetary measurements.
Please note:
If the custom metric formula uses metrics with the Money type, the result must also be a metric with the Money type. Otherwise, the analytics will display incorrect data.
If a Number is used in the formula for calculating a custom metric with the Money type, multiply it by 1000.
For example, if you need to subtract 200 from costs, the formula should look like this:
{marketing_cost} - (200*1000) -
Duration. Seconds are added to reports. Use this type for measuring duration. It is only available for metrics calculated by the formula.
Value Setting Methods
Choose how the value of your metric will be set in analytics reports:
- The value will be calculated by the formula;
- You will enter the values manually.
Formula
Use this method if you want a new metric to be calculated based on other metrics.
-
In the list on the right, select the metric you want to use in the formula:

-
If necessary, specify additional parameters for the metric:
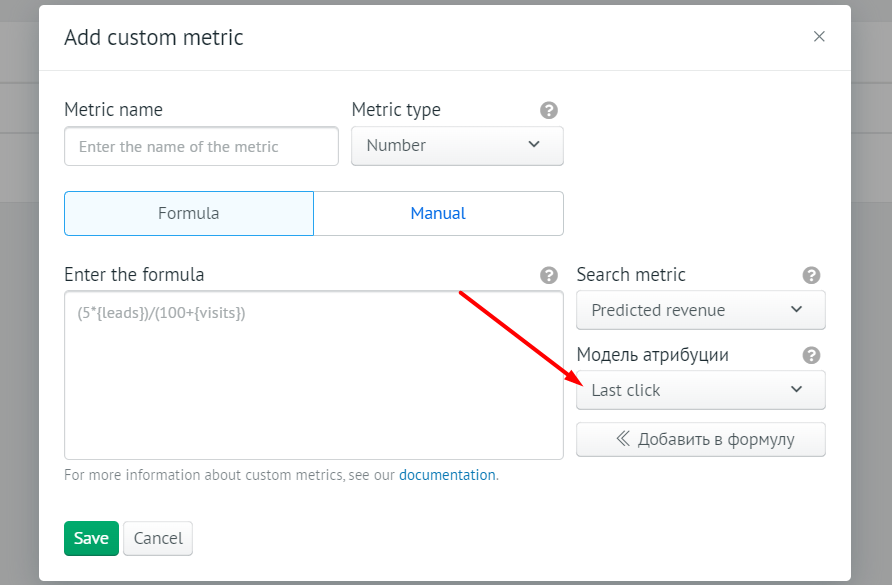
Attribution model
If you use metrics that depend on leads (for example, Conversion, Average Revenue, First Cost), you can change the attribution model. By default, the standard model is used, where leads are counted for the channel from which the last visit was made.
Please note:
To be able to choose an attribution model, Multi-Channel Analytics must be enabled and paid for in the project.
The following attribution models are available:
-
Standard (used by default);
Deal status
If you want the selected metric to include only data on deals in certain statuses, add the deal status IDs separated by commas in the following format:
{indicator[status in (1,2,3)]}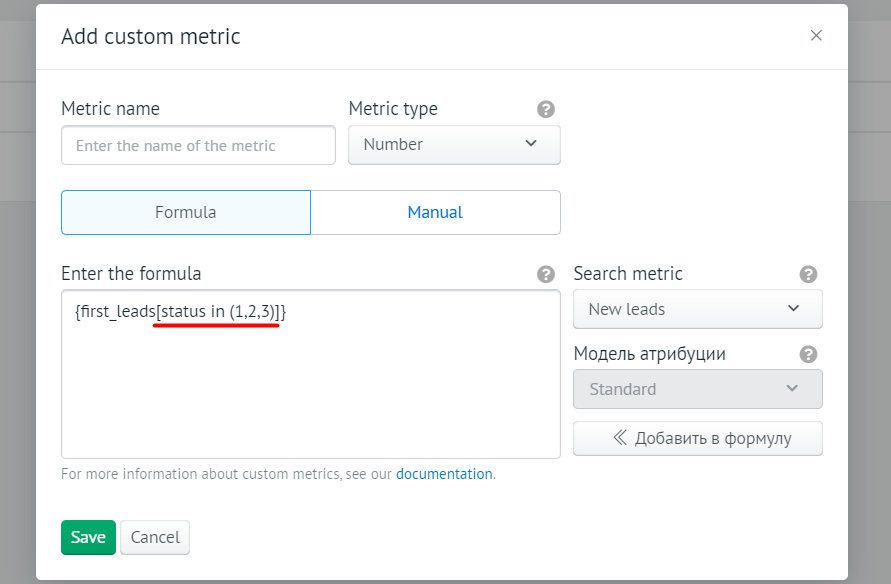
To find out the deal status IDs, use your CRM API or contact Roistat technical support.
List of metrics for which you can specify the deal status
New leads, Re-leads, Resales, Revenue from repeat sales, New sales, Revenue from new sales, Leads conversion, Leads, Sales, Potential sales, Absolute conversion, Revenue, Revenue of canceled leads, First cost, CPO, ROMI, CPL, Clients, CAC, Paid customers, EPC, Multichannel leads, The share of calls in leads.
Please note: for the Revenue metric, when filtering, you should use only the statuses from the Paid funnel, since the deal revenue is calculated only for sales. To calculate the revenue of unpaid deals in certain statuses, use the appropriate metrics (for example, Revenue of canceled leads).
-
-
Specify the formula for calculating the metric. Use the search field to add already created metrics to the formula. Select the required metric and click the Add button.
Please note:
The metrics in the formula must be placed in {}, for example: {leads}, {visits}, etc. In addition, parentheses () can be used in formulas.
You can use the following mathematical operators:
/ (division)
* (multiplication)
+ (addition)
- (subtraction)If you divide a monetary value by a numerical value in a formula, the total value must be of the Money type. This is necessary for the system to correctly read the data.
For example, if you want to know the number of site visits per sale, you need to do the following:
- Give the metric a name (for example, Number of visits per sale).
- Select the Number data type.
- Select Visits from the list of metrics and add the value to the formula field.
- In the formula window, put a division sign / after {visits}.
- Select Sales from the list of metrics and add the metric to the formula field.
- The result should be the following formula:
{visits}/{sales}.
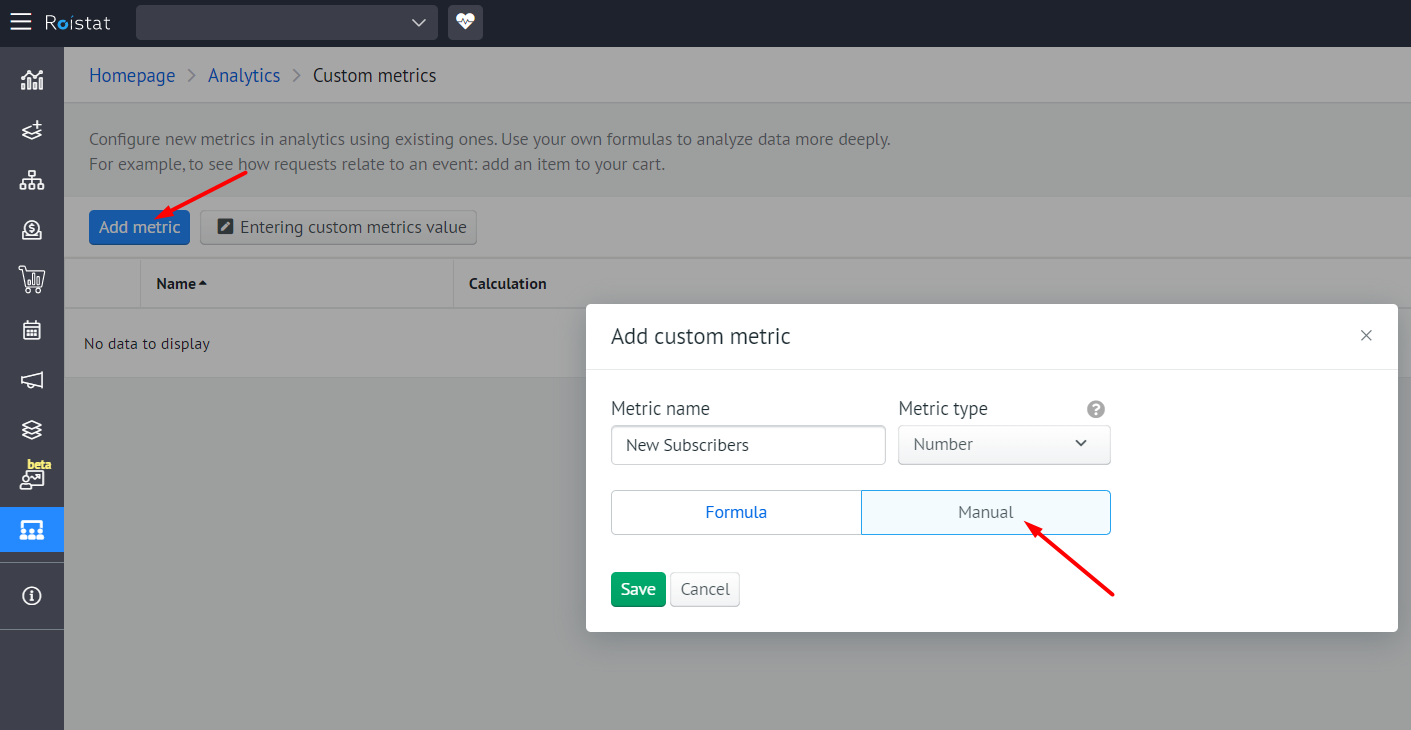
Manual
If you are creating a metric that is entered manually, specify the name and type of the metric, and then fill in its values in a separate interface – see the Entering a custom metric value section.
To view only new leads from new customers in the report, you need to create a custom metric that will be calculated using the formula new leads = leads - re-leads.
Entering a Custom Metric Value
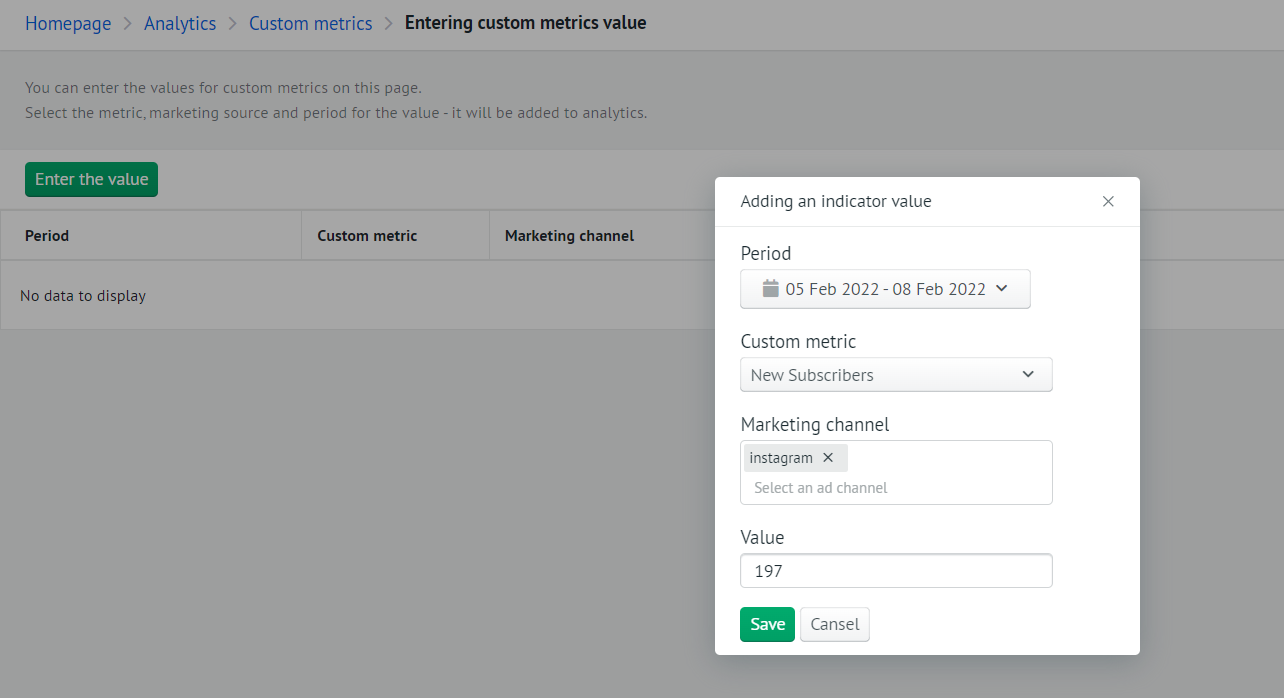
To enter the values of metrics with manual setting, go to Analytics → Custom metrics → Entering custom metrics value:
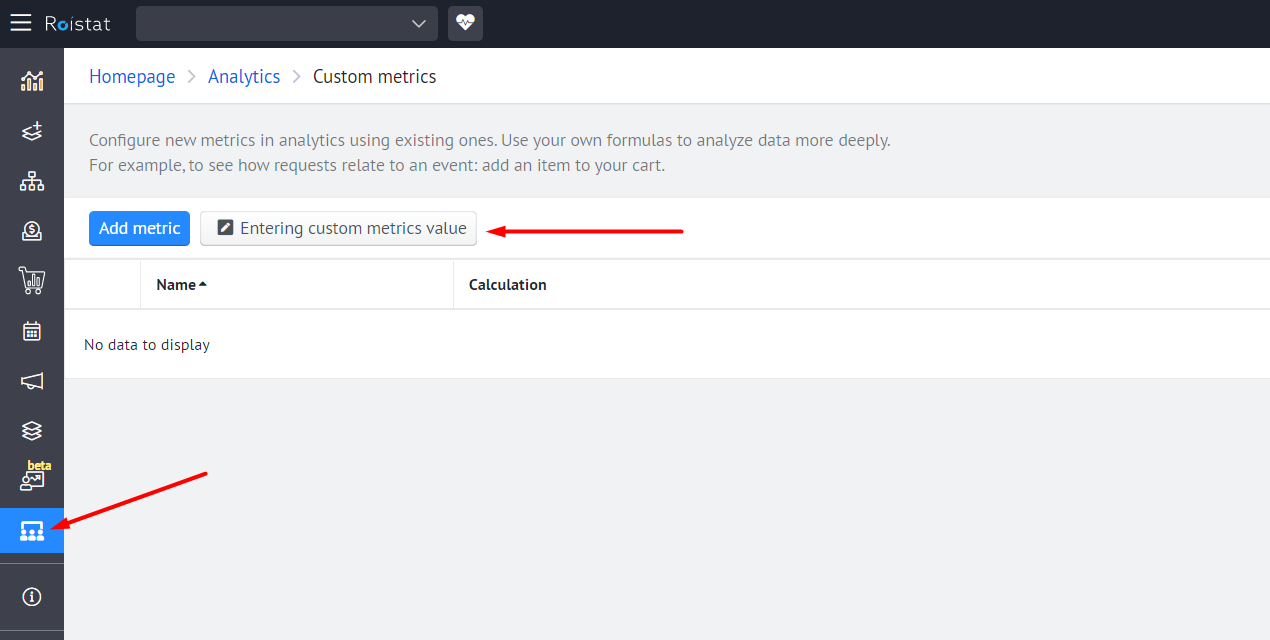
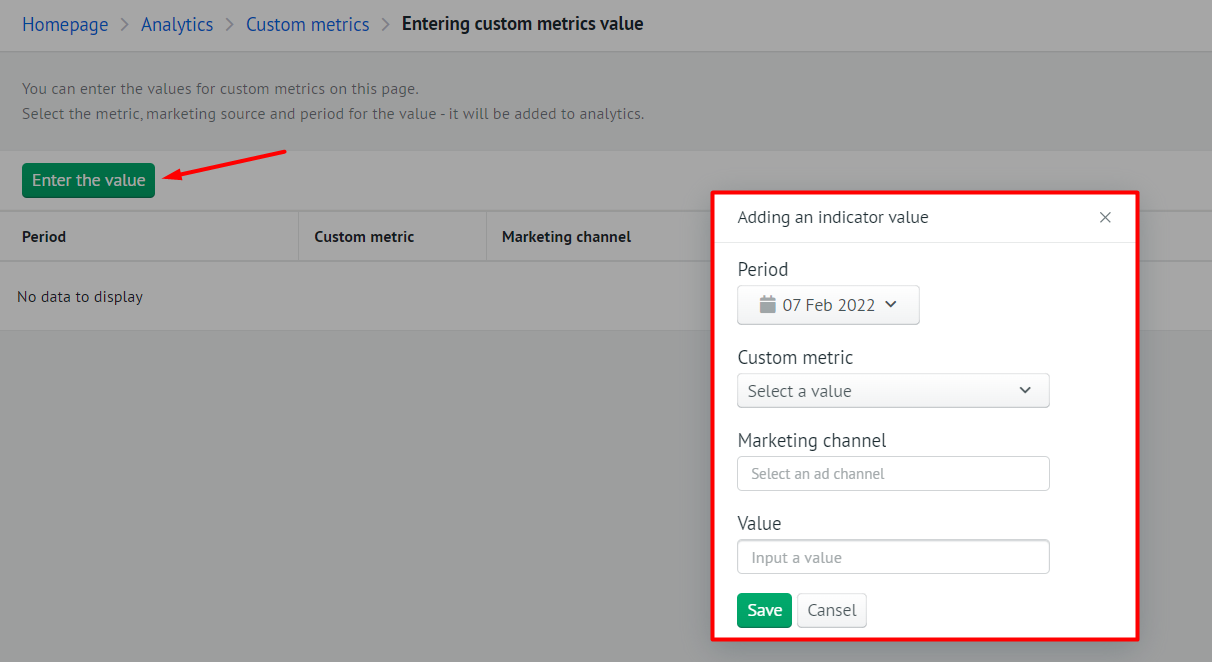
Click Enter the value and add:
- The period (inclusive) for which the values will be displayed in the reports.
- The metric for which the value will be entered.
- Advertising source to which the value refers.
- The value.
In the reports, the values will be evenly split for each day of the month, and you will be able to track the daily execution of the plan.
For example, for the period from November 6 to November 19, you entered the value 1400. Since this period has 14 days, the value of 100 will be displayed in the analytics table for November 10.
Value Input Restrictions
-
You cannot enter the values of one metric from the same source for overlapping periods:
Planned sales in Google Ads for 01.12.2019 – 31.12.2019 and 10.12.2019 – 21.12.2019
Planned sales in Google Ads for 01.12.2019 – 15.12.2019 and 10.12.2019 – 31.12.2019
-
You cannot enter values for a lower level if you have already entered a value for a higher level in this period:
Planned sales in Google Ads for 01.12.2019 – 31.12.2019 and Google Ads Search for 01.12.2019 – 31.12.2019
Planned sales in Google Ads for 01.12.2019 – 31.12.2019 and Google Ads Display Network for 20.12.2019 – 31.12.2019
-
How to enter values:
Planned sales in Google Ads for 01.12.2019 – 15.12.2019
Planned sales in Google Ads Search for 16.12.2019 – 31.12.2019
Planned sales in Google Ads Display Network for 16.12.2019 – 31.12.2019
Use in Analytics Reports
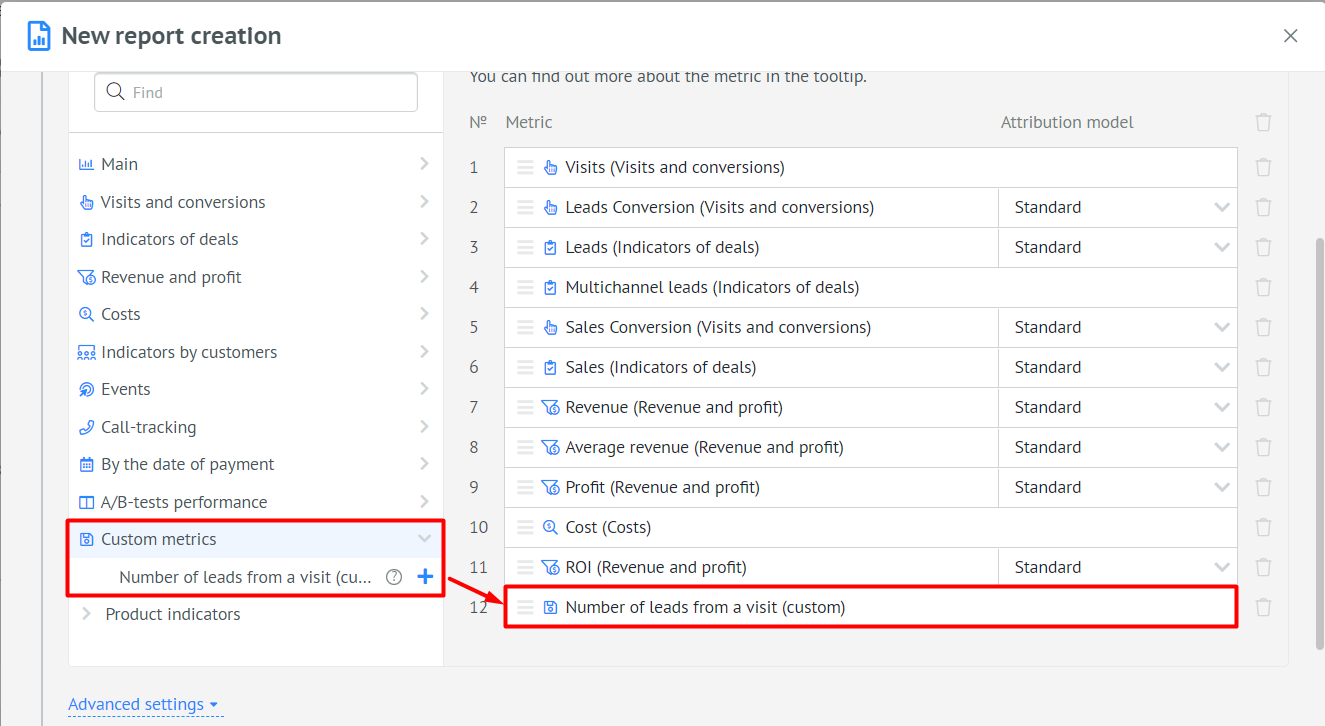
In order to use customized metrics in analytics reports, go to the Reports tab, open the desired report and click Report Settings → Metrics:
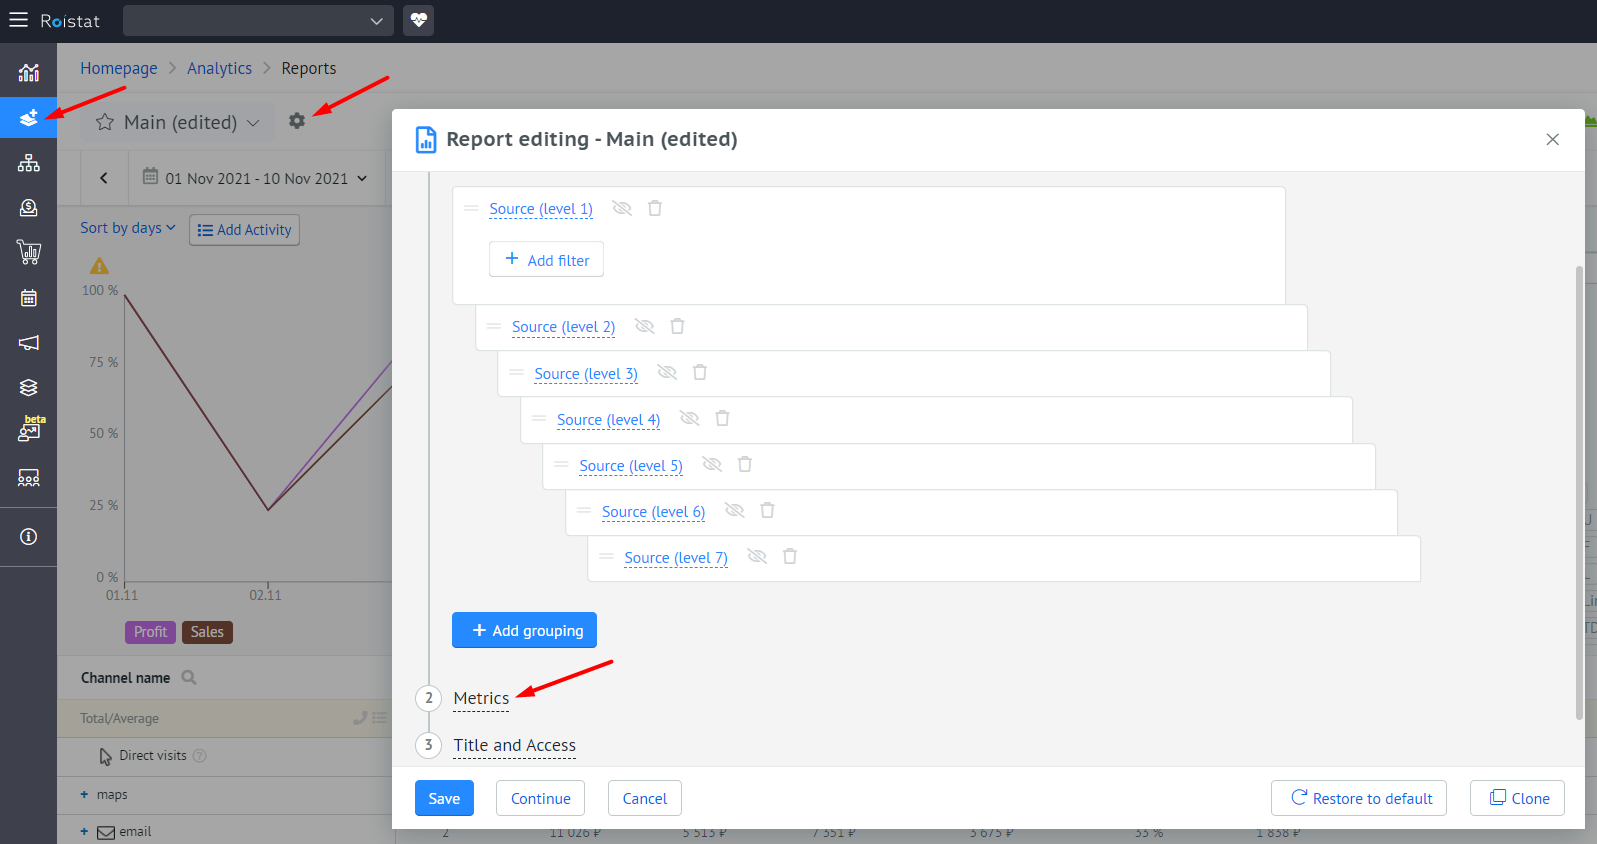
Go to the Custom metrics category to see the metrics you've created. Click on a metric to add it to the report:
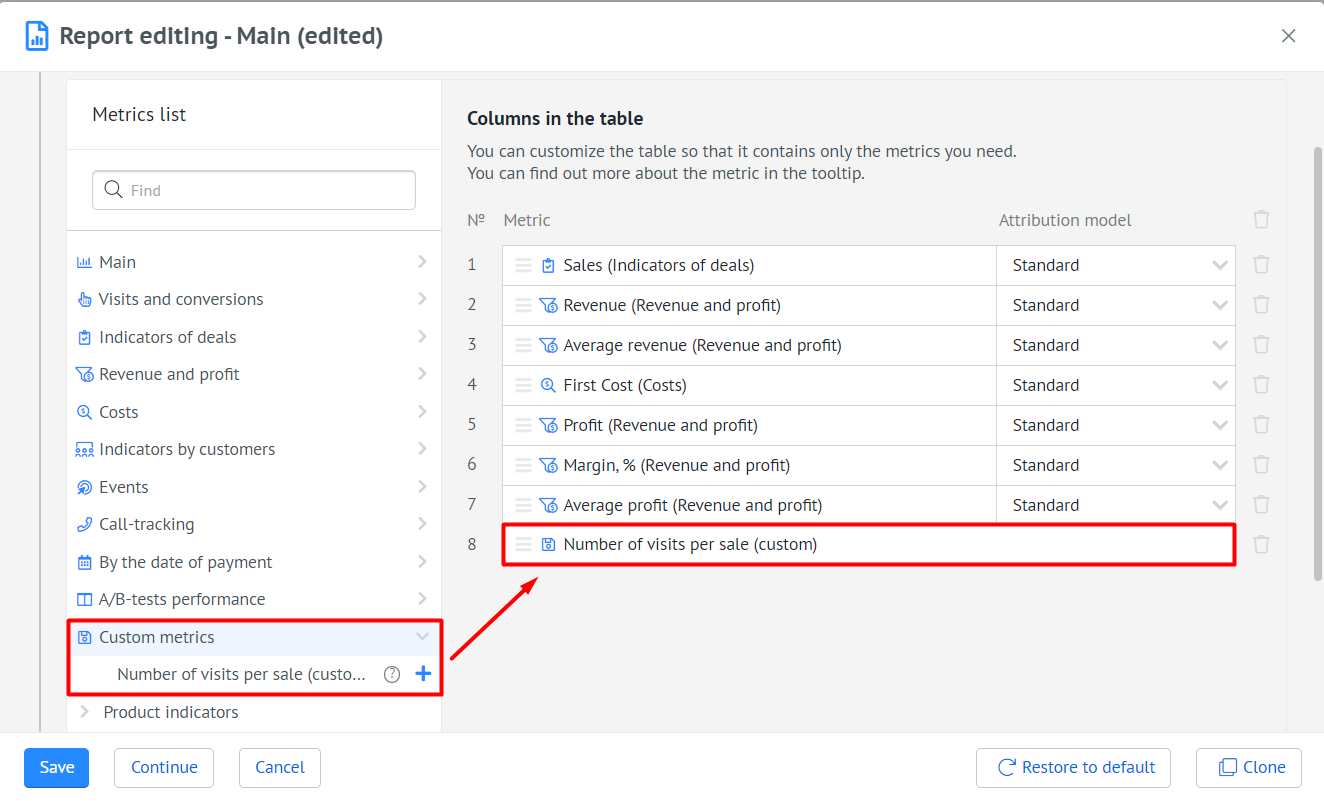
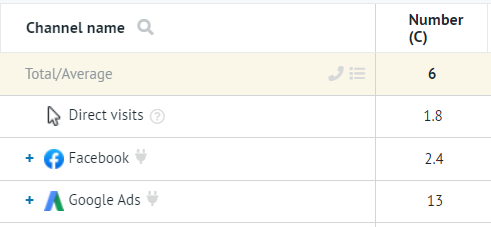
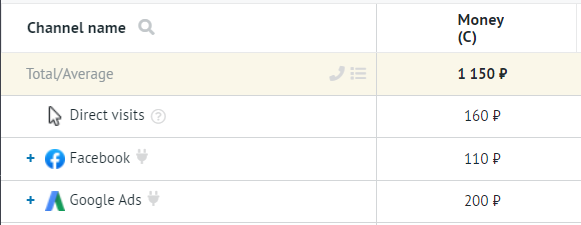
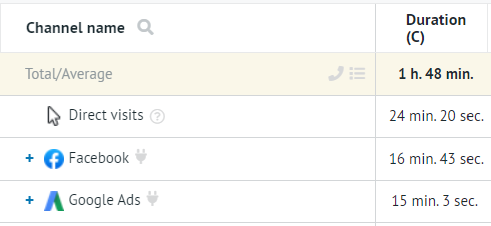
After adding custom metrics to the report, you will see them in the analytics in the context of advertising sources.
Using Numeric Fields of a Deal as Metrics in Analytics
To use numeric fields of a deal as metrics in analytics, you need to create a custom metric. To do this, go to Analytics → Custom metrics and click the Add metric button:

You can use the values of the deal numeric fields in a formula when creating a metric. To do this, select the fields from the list (they will be marked accordingly):
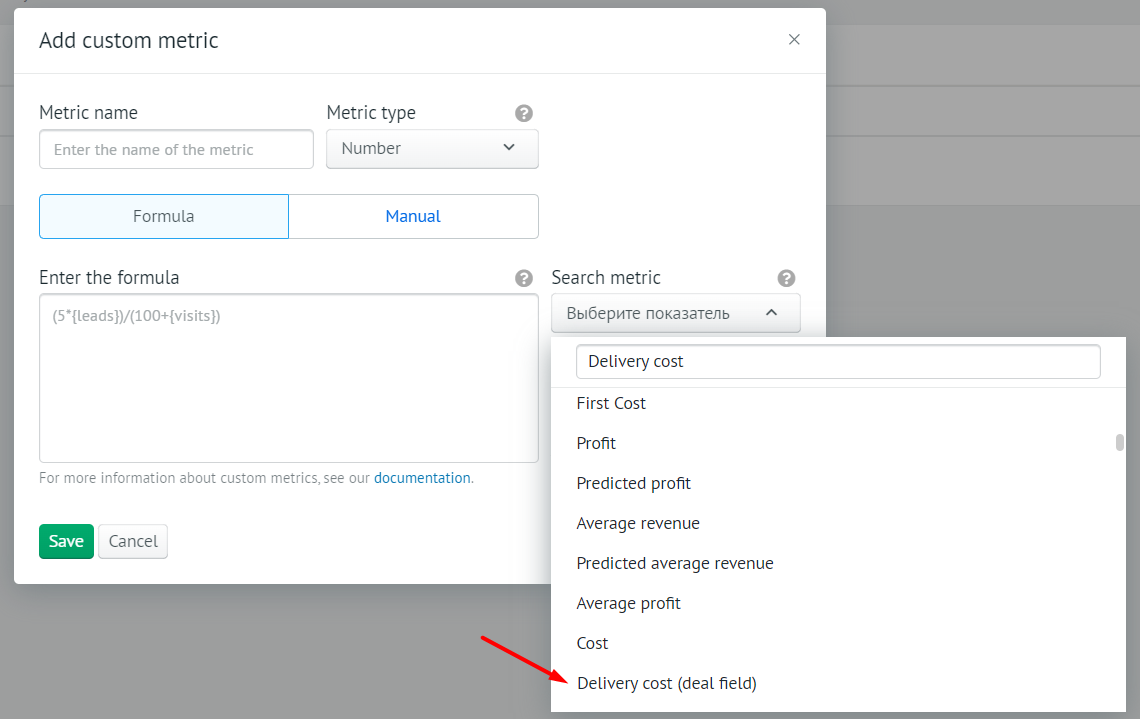
After that, you can use this metric in any analytics reports. Just select it when creating a report:

Please note:
When you change or remove CRM integration, custom metrics that use deal fields will be removed from analytics.
Examples of Using Custom Metrics
Below you will find some examples of using custom metrics to improve business performance.
Analyzing the Effectiveness of Advertising Sources Based on Additional Data
Tracking the Effectiveness of SMM Activity
You will be able to see how well new subscribers convert into visits, leads, etc.
Task: evaluate the effectiveness of SMM activities aimed at attracting followers to the Instagram page.
Preparatory setup:
-
Create a manual metric New Subscribers:
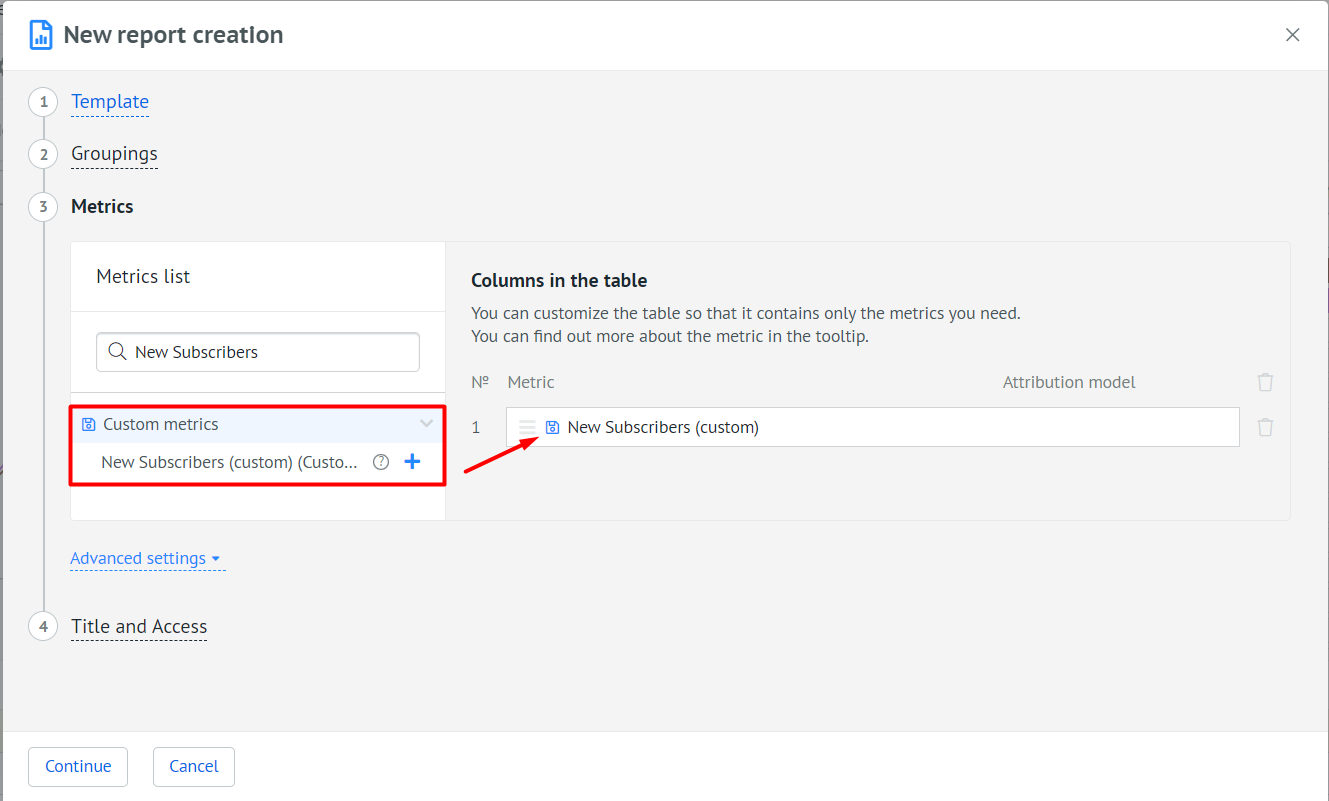
-
Create an SMM Performance report with the custom metric:
-
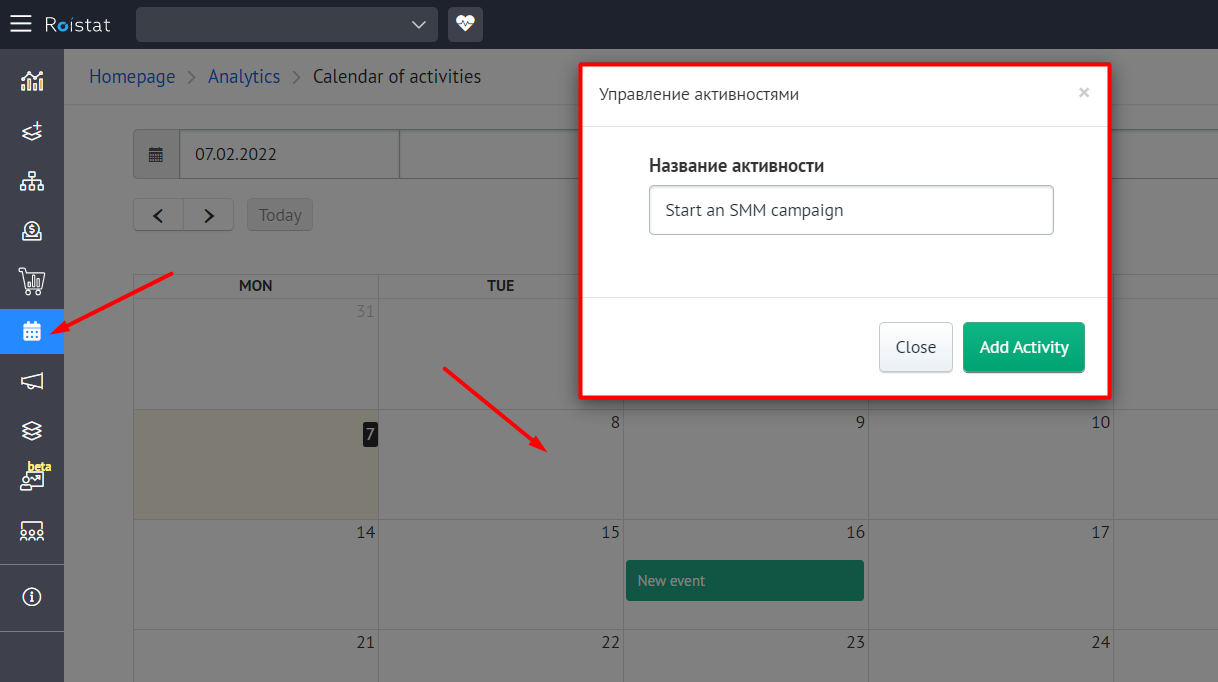
Go to the Calendar of Activities and set up a new activity: Start an SMM campaign. To do this, click on the desired date in the calendar:
Working with data:
Record new subscribers regularly using the appropriate option. We will add the value every 3 days:
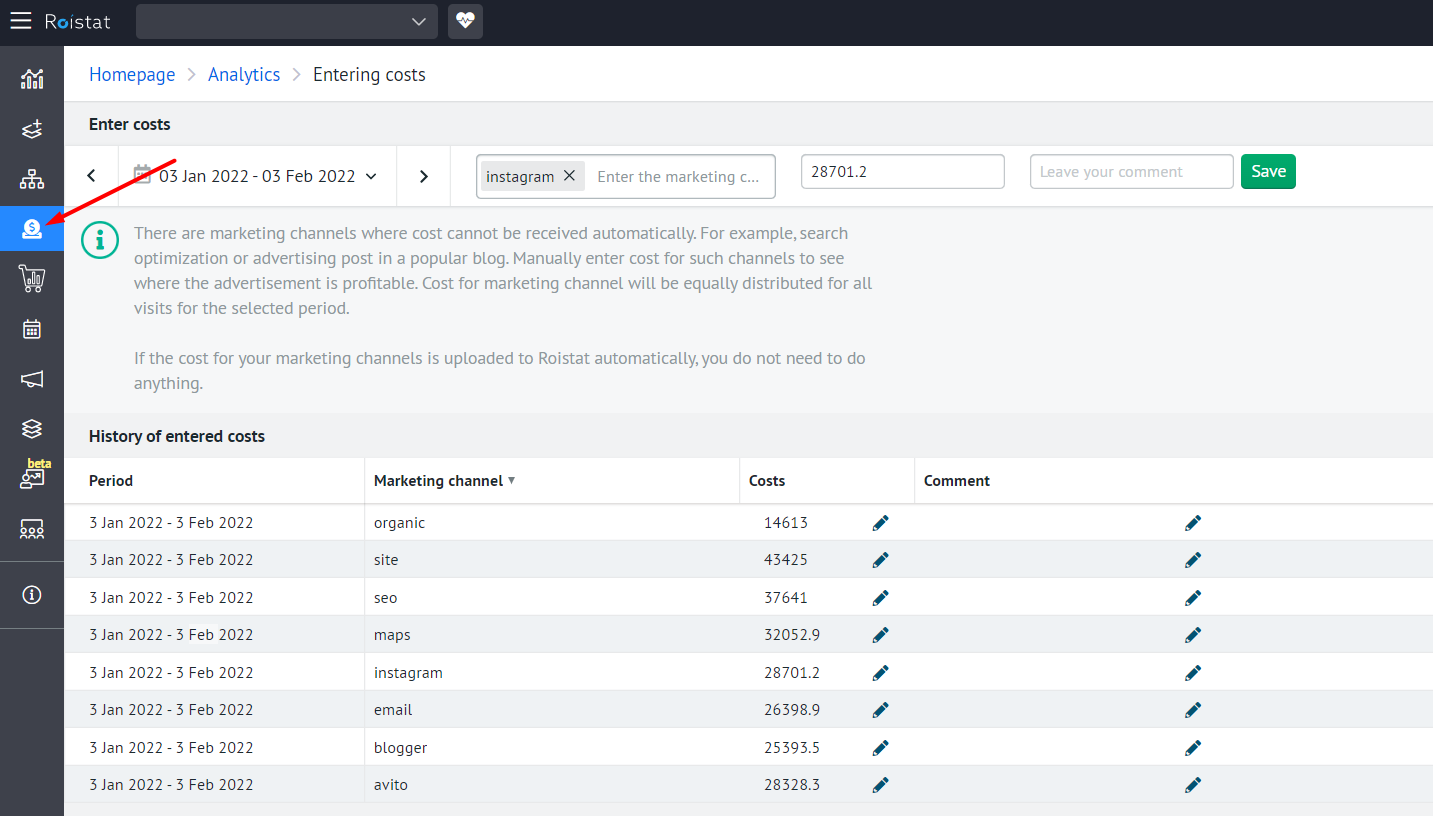
Add channel costs:
Analytics:
Let's look at the report and analyze how the increase in subscribers affected the total number of leads and sales for this source:
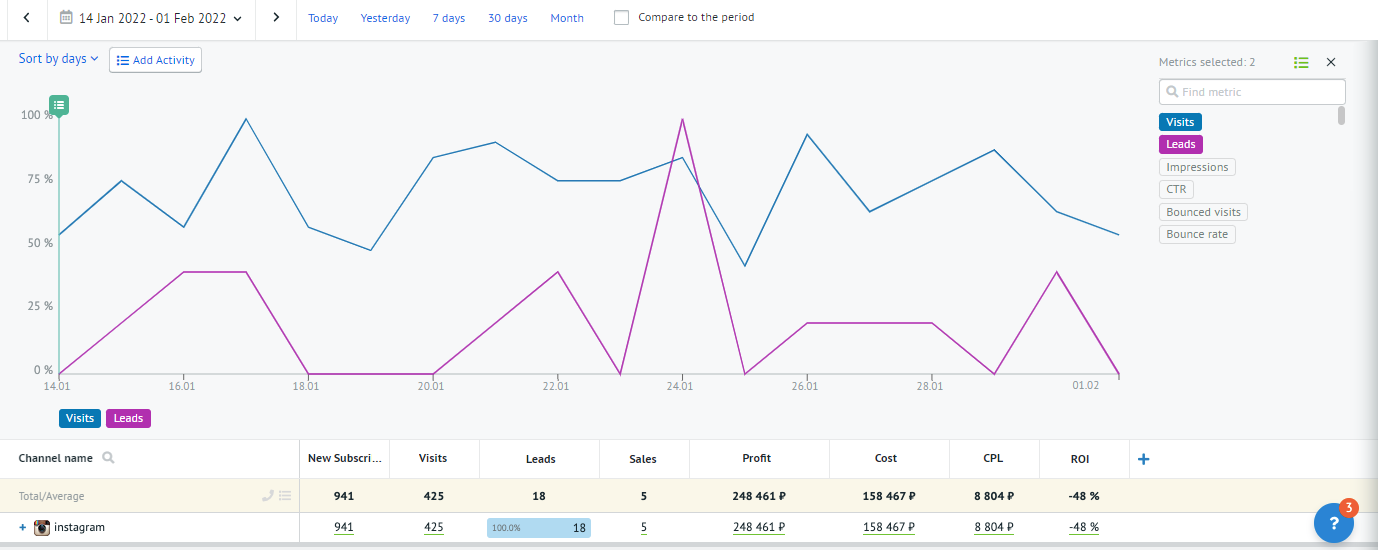
Despite the fact that new subscribers often went to the site from posts, quite a few leads were generated, which resulted in a negative ROI on marketing activity.
Marketing Planning
Creating Plan/Result Reports Using Manual Metrics
Create manual metrics Planned Sales, Planned Leads, etc. to set the level you want to achieve for each source.
In the reports, the plan will be evenly split for each day of the month, and you can track its daily progress.
Including Additional Costs when Calculating ROI
You can add costs for contractors working with a specific advertising channel in order to correctly calculate the final value of the ROI.
-
Create a manual metric Contractor costs. Each month, fill in the value that you spent on a particular contractor.
The value will only be added for the level for which you entered it. If you enter costs for the entire channel, they will not be spread across the campaigns in the channel.
-
Add a new metric ROI including contractors calculated by the formula. Use the manual metric Contractor costs in the formula.
Creating Metrics Using Tag Filtering
-
Copy the ID of the Tags system field.
How to find out the ID of the Tags system field
- In the Roistat project, go to the Analytics section.
- On the page with the Analytics report, open the developer tools (F12 on Windows, Cmd+Opt+J on Mac) and go to the Network tab:
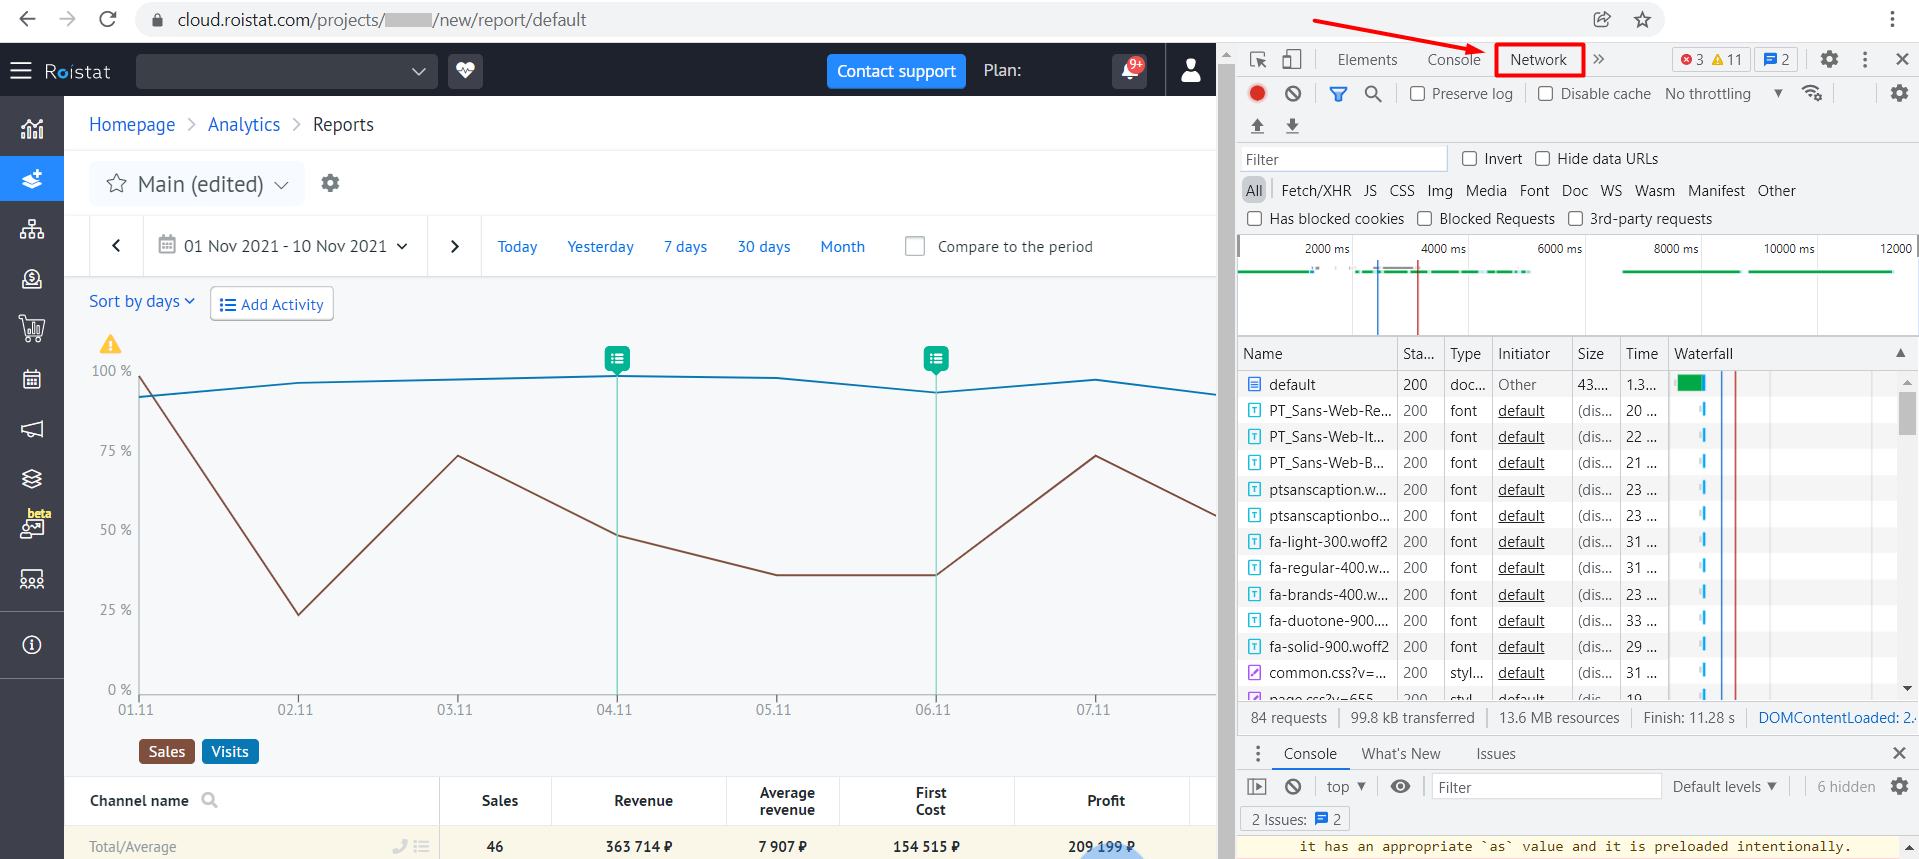
- Reload the page(F5 on Windows, Cmd+R on Mac). If an authorization window appears, log in to your account and repeat steps 1-2.
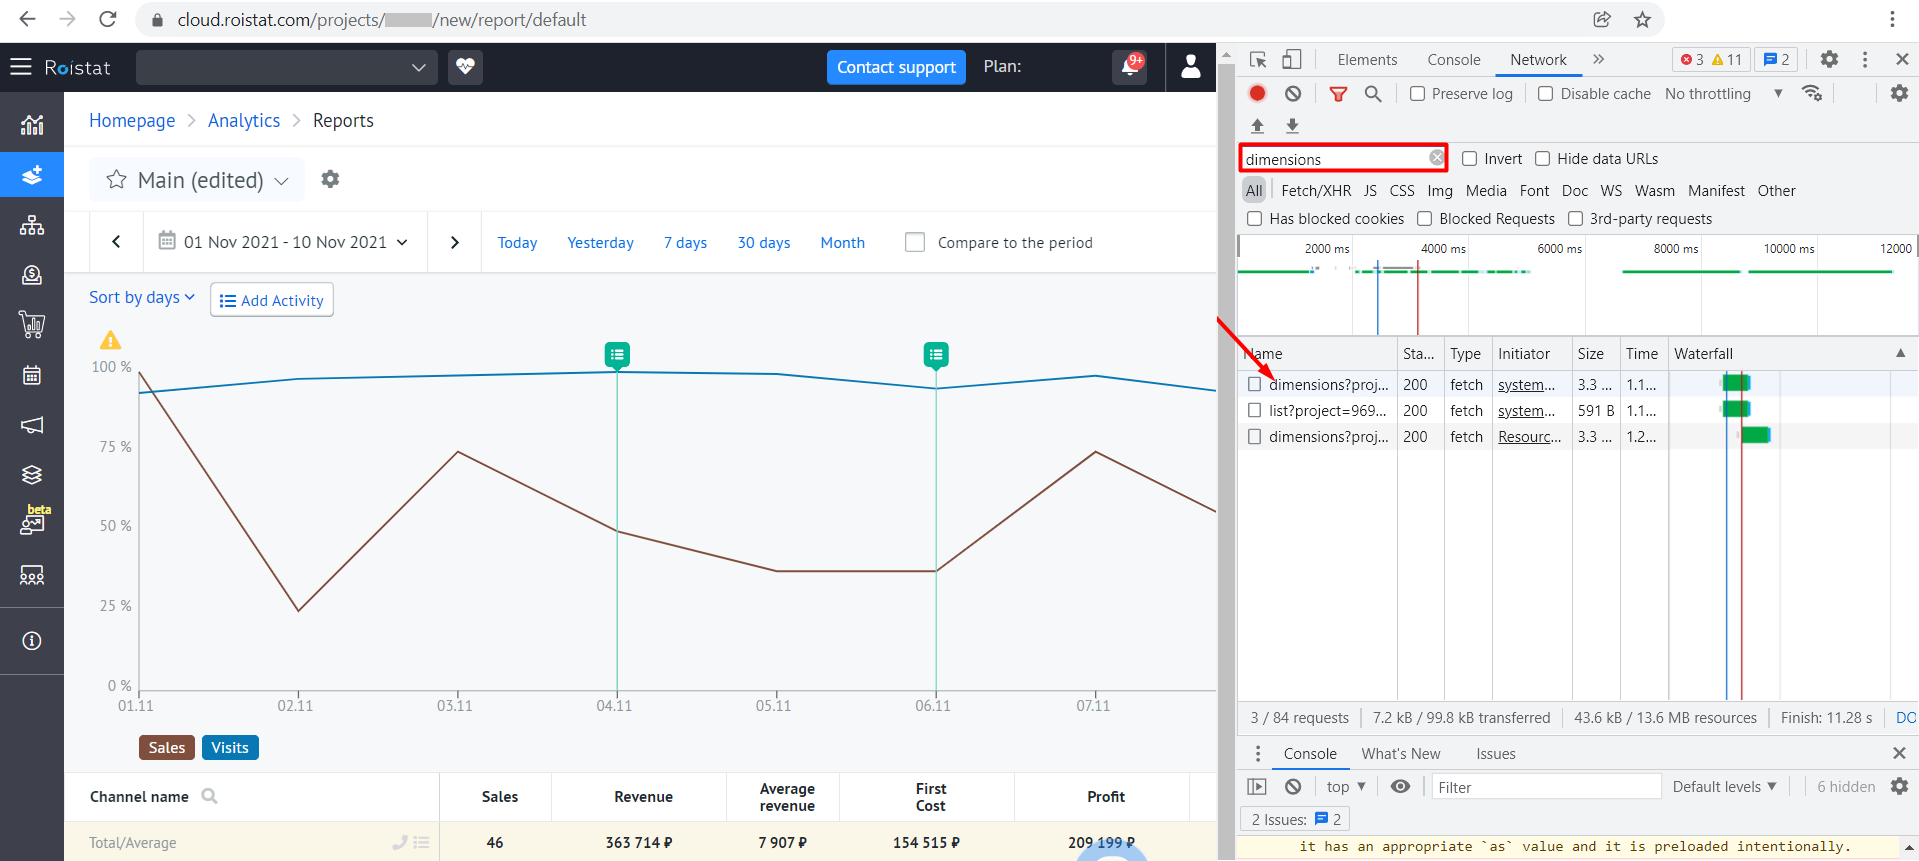
- In the search bar of the Network tab, enter dimensions and click on the first line of the result:
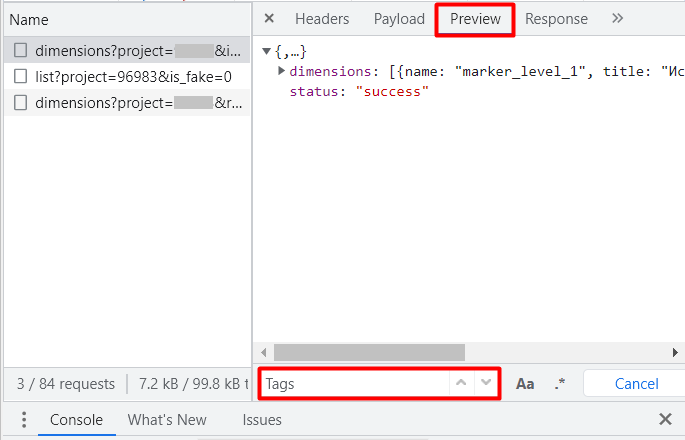
- In the window that opens, go to the Preview tab. Press Ctrl+F (on Windows) or Cmd+F (on Mac) and type Tags in the search bar:
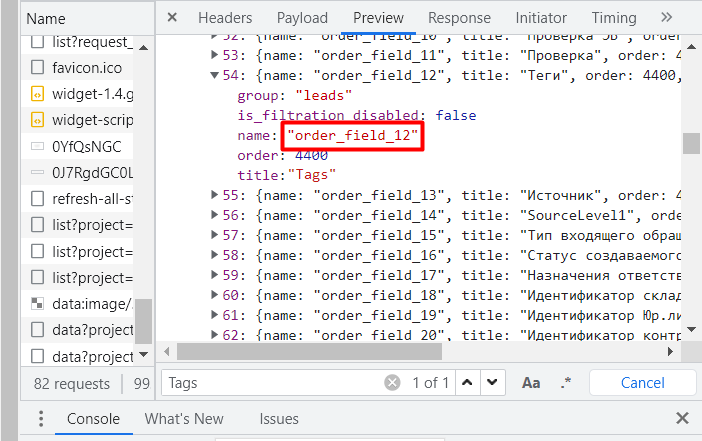
- Copy the name value without quotes. This value is the system field ID:
-
Go to the Custom metrics section and click on Add metric.
-
Add the metric by which you want to filter the data, such as Leads. A variable with the name of the metric will appear in the formula:
-
Before the closing bracket in the metric name, add the ID of the Tags field and the tag value in the following format:
{metric[ID in (value)]}metric– metric nameID– the field ID you copied in step 1value– tag value to be used when calculating the metric
For example, if for the {leads} metric only leads with the Instagram tag should be taken into account, the result might look like this:
{leads[order_field_12 in (Instagram)]}To specify multiple tags at once, list them separated by commas:
{leads[order_field_12 in (Google Ads, Europe)]} -
Save the metric and add it to the desired report.
If you need to create multiple metrics with different tags, repeat steps 2-5 using the same field ID and different tags.