Attribution Models
An attribution model is a set of rules for calculating the value of each visit within the chain of visits that converted to a lead. Attribution models can be selected when building an Analytics report, as well as when adding custom metrics.
Please note:
The chain of visits will be displayed in the deal card if your plan includes the Multi-Channel Analytics feature.
When calculating metrics for different attribution models, all leads are taken into account, and not just those with several visits.
Attribution models can be selected for lead-related metrics:
-
Visits and conversions: Leads Conversion, Sales Conversion, Absolute Conversion;
-
Revenue and profit: Revenue, Average Revenue, Average Profit, Profit, Net Profit, ROI, ROMI, Margin %, Potential Revenue, Predicted ROI, Predicted Revenue, Revenue of Canceled Leads, Predicted Profit, Predicted Average Revenue;
-
Costs: First Cost, SOC %, CPL, CPO, Predicted CPO;
-
Deals: Leads, Sales, Potential Sales, Rejected Leads, Predicted Sales.
Please note:
Attribution models are not available for the following metrics: Multichannel Leads (Main) and Multichannel Leads, % (Indicators of deals).
More information about setting up metrics in Analytics can be found in the Reports article.
Standard
This model is used by default in Roistat Analytics.
All leads created within the selected period are taken into account, regardless of the date of the visit. Each lead will be counted for the channel of the last visit.
The difference from the Last click model is that in the standard model only leads created within the selected period will be shown. The Last click model shows leads with the last visit made within the selected period. The lead itself can be created later.
First Click
This model only counts the leads where the first visit in the chain was made within the selected period.
You can use it to identify the channels through which customers learn about your products.
Last Click
This model only counts the leads where the last visit in the chain was made within the selected period.
You can use it to identify the channels through which customers buy your products.
The example below shows the difference from the standard model:
The selected period is December 1. Let's assume that there were only two visits by the same client on this day: the first one was made from Facebook ads on December 1, the second one was made from Google Ads on December 1 as well. The lead was created on December 2 after a direct visit. In this case, the Standard model for December 1 will show 0 leads, and the Last click model will show 1 lead.
Last Paid Click
When calculating metrics for this model, the last paid source is taken into account. That is, the model counts the last visit with costs in Analytics.
This includes:
-
Any visit from an integrated advertising channel;
-
Visits from sources with manually entered costs.
Let's consider the distribution of source values in this model for a chain of visits:
| Visit number | Source | Source value in metrics |
|---|---|---|
| 1 | 0 | |
| 2 | SEO | 0 |
| 3 | Google Ads | 0 |
| 4 | Bing | 1 |
| 5 | Direct visit | 0 |
UShape
This model got its name because the value of visits is distributed over three points, which resembles the letter U:
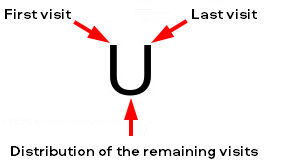
The conversion value is distributed among these points in the following ratio:
-
First visit: 40% of the value;
-
Last visit: 40% of the value;
-
Between the remaining visits: an even distribution of the remaining 20%.
If there were only two visits, the first one gets 40% of the value, and the second one gets 60%.
If the lead has one visit, then 100% of the value is fully assigned to one visit.
The model only counts the leads where at least one visit in the chain was made within the selected period.
There can also be multi-channel visits within one channel. For example:
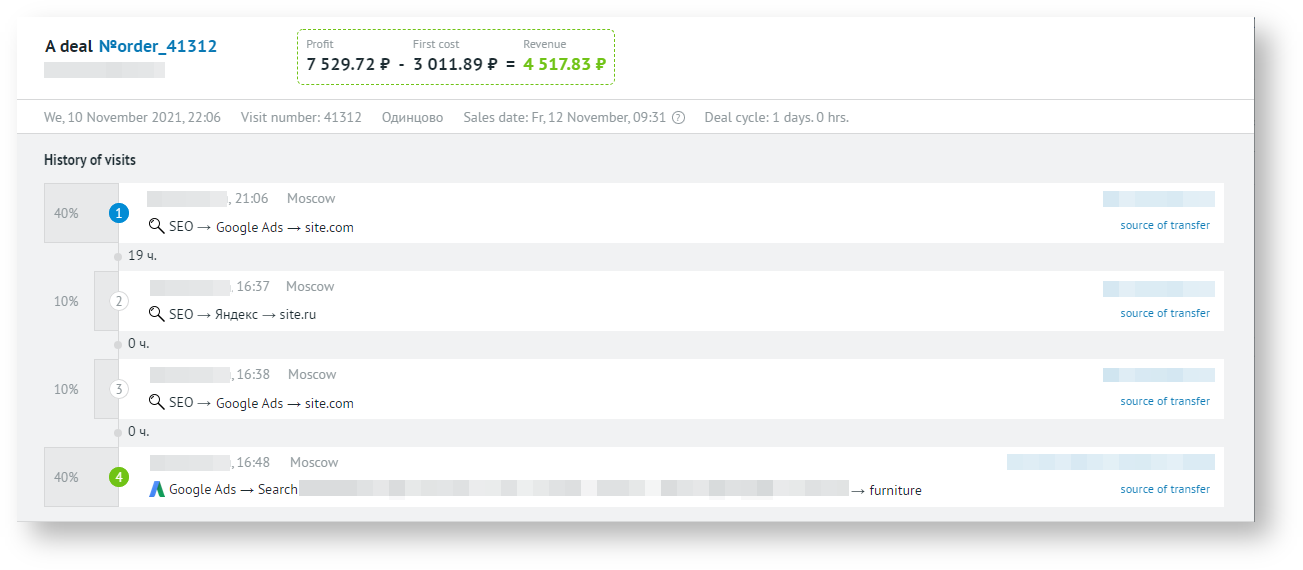
The channel SEO → Google Ads → site.com gets 60% of the value (40+10+10). The keyword furniture will get 40% of the value.
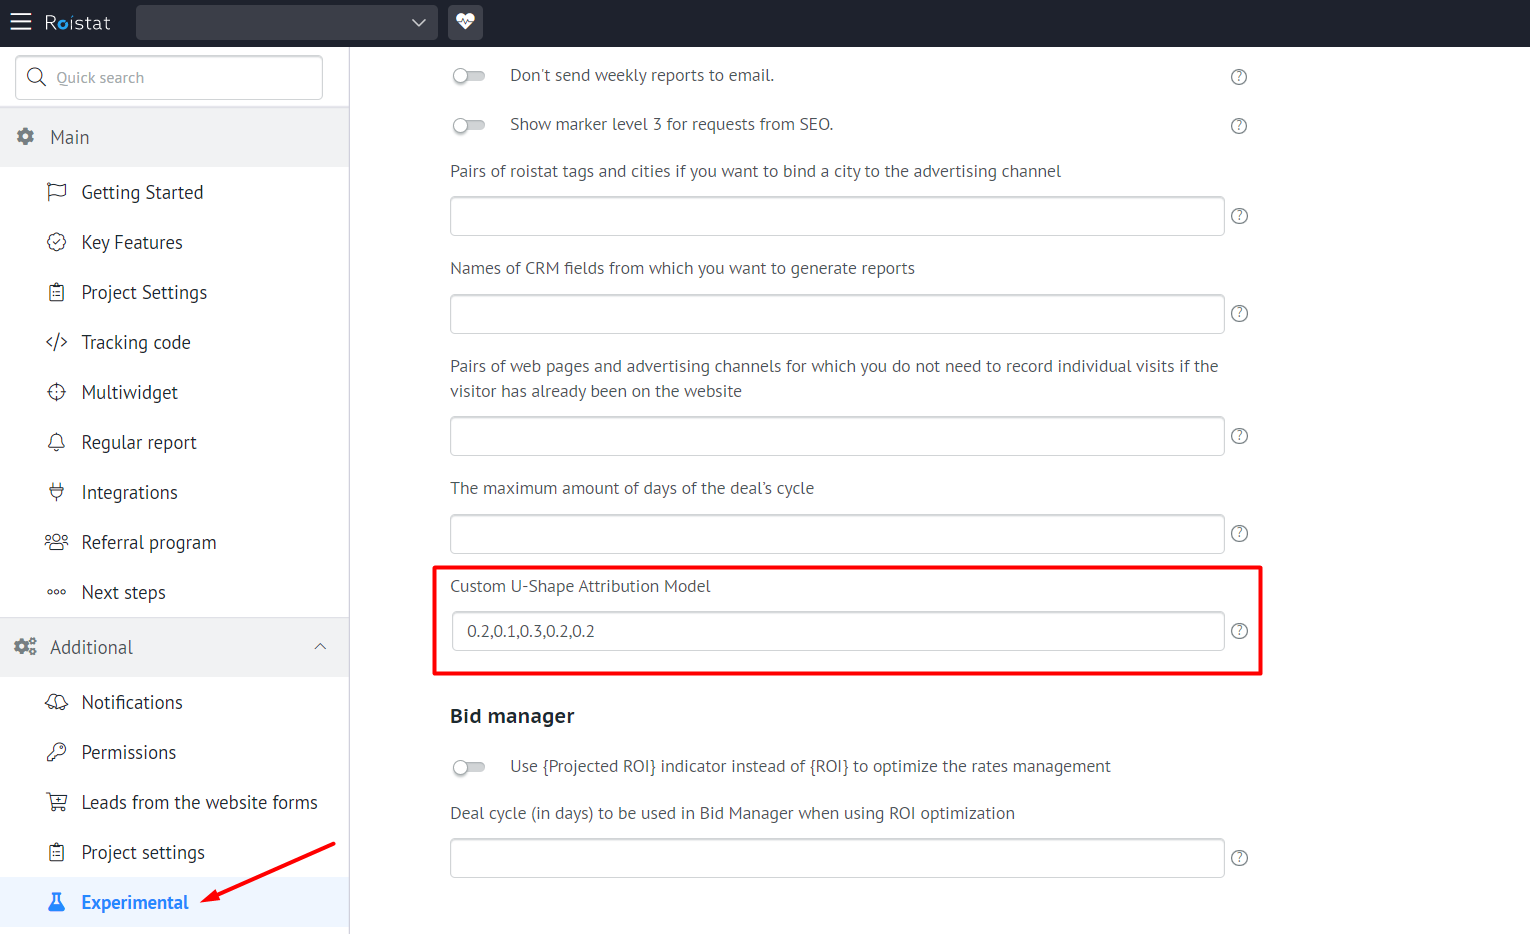
Custom UShape
You can add a custom attribution model using the UShape template and set the desired value distribution to get the data that suits your business.
To add this model, open Settings → Experimental → Custom U-Shape Attribution Model and enter source values:
In a regular UShape model, the values are distributed as follows:
-
First visit: 40% of the value;
-
Last visit: 40% of the value;
-
Between the remaining visits: an even distribution of the remaining 20%.
In the custom UShape model, you can set the value of visits yourself. For example, if you want the first visit to have a value of 60%, the last visit – 20%, and the remaining 20% to be evenly distributed over the rest of the visits, you need to enter the desired values as follows: 0.6, 0.2, 0.2.
Please note:
Values can be in the range from 0 to 1, and their sum must equal 1. That is, the value of 50% must be entered as 0.5 (with a dot). For example, 0.5, 0.3, 0.2.
More flexible customization is also available: you can set the value of the second visit and the next-to-last visit. For example, if you want the first visit in your chain to have a value of 10%, the second visit – 20%, the next-to-last visit – 10%, the last visit – 20%, and the remaining 40% to be evenly distributed over the rest of the visits, enter the values as follows: 0.1, 0.2, 0.4, 0.1, 0.2.
Examples
Let's see how the custom UShape model works when the user made 6 visits from different advertising sources before buying:
- Google Ads
- Bing
- Unisender
- Criteo
Let's assume that you want to give 60% of the value to the first visit (because you consider it the most important), give 30% to the last visit, and spread the remaining 10% evenly over the remaining visits. Then the values should be distributed as follows:
- Google Ads – 60%
- Bing – 2.5%
- Instagram – 2.5%
- Facebook – 2.5%
- Unisender – 2.5%
- Criteo – 30%
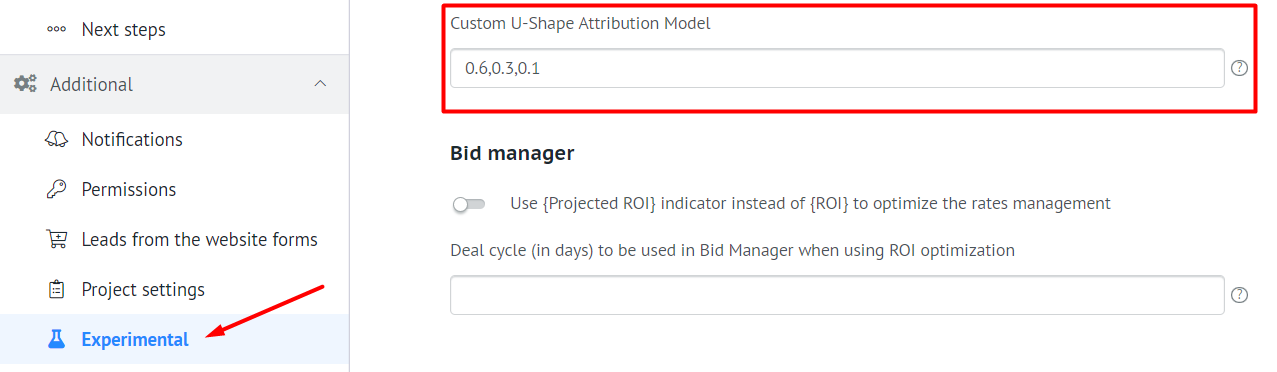
To do this:
-
Go to Settings → Experimental → Custom U-Shape Attribution Model and enter the values as follows: 0.6, 0.1, 0.3.
-
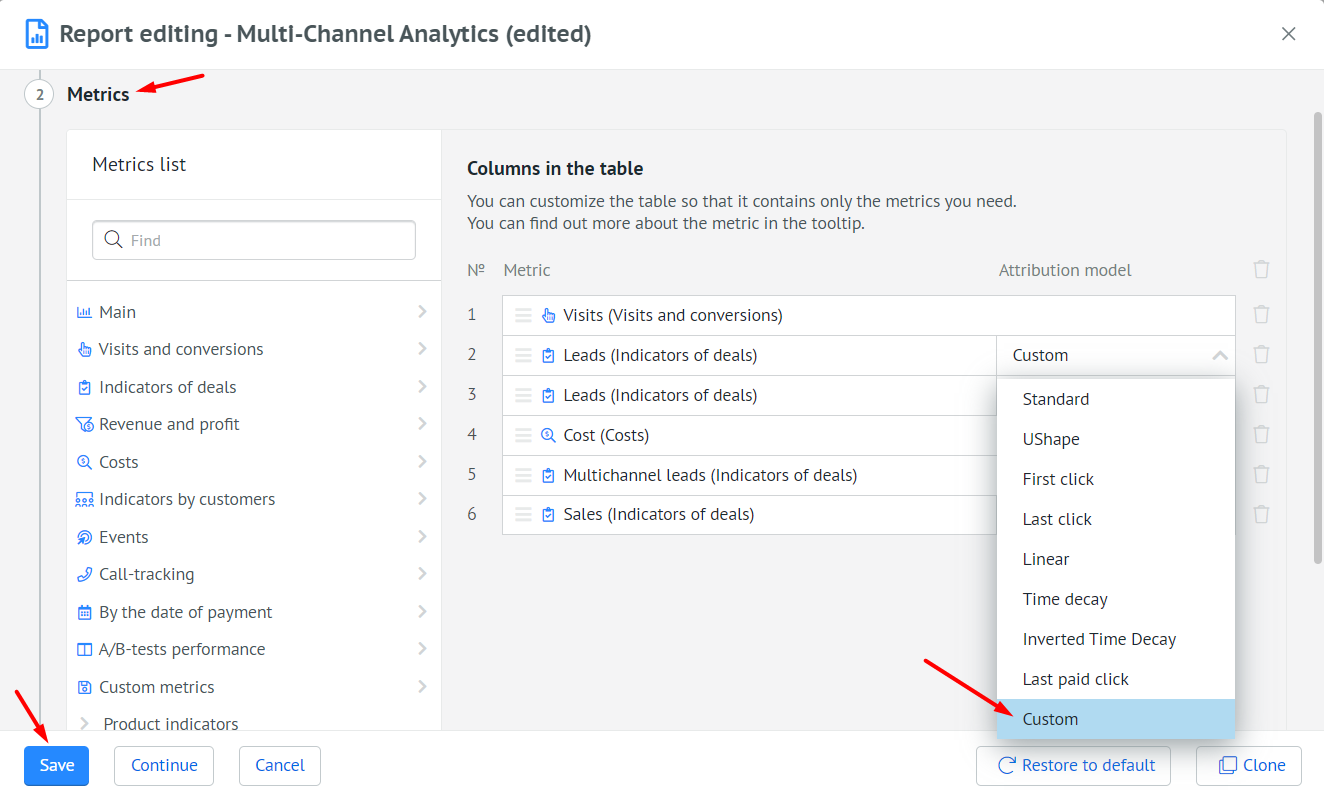
Open Analytics → Multi-Channel Analytics → Report Settings → Metrics, set the Custom attribution model for the required metrics and click the Save button:
-
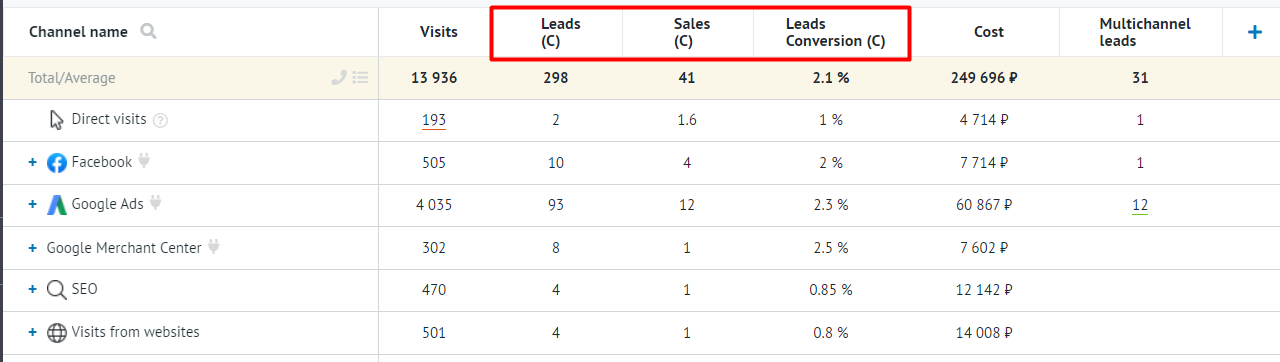
Open the report. Metrics with the custom attribution model will be displayed with a C character:
How Are the Values of Sources Distributed If the Number of Values Exceeds the Number of Visits
Let's assume that before the purchase, the number of visits was less than the number of values in the selected attribution model. In this case, the value of advertising sources will be distributed as follows:
| Custom UShape | Number of visits | Distribution of value |
|---|---|---|
| 0.3, 0.2, 0.5 | 2 | First visit – 30% value; second visit (the last one) – 70% value (the remaining value was given to the last visit). |
| 0.2, 0.1, 0.2, 0.2, 0.3 | 2 | First visit – 20% value; second visit (the last one) – 80% value (the remaining values were given to the last visit: 0.1, 0.2, 0.2, 0.2, and 0.3). |
| 0.3, 0.1, 0.2, 0.1, 0.3 | 3 | First visit – 30% value; second visit – 10% value; third visit (the last one) – 60% value (the remaining values were given to the last visit: 0.2, 0.1, and 0.3). |
| 0.3, 0.1, 0.2, 0.1, 0.3 | 4 | First visit – 30% value; second visit – 10% value; third visit – 10% value (equals the next-to-last value in the model); fourth visit (the last one) – 50% value (the remaining value (0.2) was given to the last visit. |
Therefore, if the number of sources is less than specified in the chain, the values will be distributed among the first sources in the chain, and the remaining values will be given to the last source.
Linear
The conversion value is evenly distributed across all visits in the chain. For example:
- First visit – 25% of the value;
- Second visit – 25% of the value;
- Third visit – 25% of the value;
- Fourth visit – 25% of the value.
Time Decay
The conversion value within the chain increases towards the last visit. The formula for calculating the value of each visit:
(sequence number of the visit in the chain)/(sum of visit numbers in the chain)
Example for four visits:
-
The sum of visit numbers in the chain is calculated: 1+2+3+4=10.
-
The value is calculated for each visit:
| Visit | Sequence number of the visit in the chain | Value calculation | Final value |
|---|---|---|---|
| First | 1 | 1/(1+2+3+4) | 10% |
| Second | 2 | 2/(1+2+3+4) | 20% |
| Third | 3 | 3/(1+2+3+4) | 30% |
| Fourth | 4 | 4/(1+2+3+4) | 40% |
Inverted Time Decay
The conversion value within the chain decreases towards the last visit. The formula for calculating the value of each visit:
(visit number in the chain, counting from the end)/(sum of visit numbers in the chain)
-
The sum of visit numbers in the chain is calculated: 1+2+3+4=10.
-
The value is calculated for each visit:
| Visit | Visit number, counting from the end | Value calculation | Final value |
|---|---|---|---|
| First | 4 | 4/(1+2+3+4) | 40% |
| Second | 3 | 3/(1+2+3+4) | 30% |
| Third | 2 | 2/(1+2+3+4) | 20% |
| Fourth | 1 | 1/(1+2+3+4) | 10% |
An example of using different attribution models
Let's say we have the following data on visits and deals of one client:
| Visit number | Visit date | Visit channel | Lead date | Lead number |
|---|---|---|---|---|
| 1 | September 1 | Bing | ---- | ---- |
| 2 | September 2 | September 2 | 1 | |
| 3 | September 3 | September 3 | 2 | |
| 4 | September 4 | ---- | ---- | |
| 5 | September 5 | September 9 | 3 |
Let's say we form an analytics table for the period from September 2 to September 5.
| Attribution model | Number of leads | Distribution | Description |
|---|---|---|---|
| Standard | 2 | Google – 1 (lead №1), Instagram – 1 (lead №2) | Leads created strictly in the selected period are counted. The lead is counted for the channel of the last visit. Lead №3 was not counted, since it was created on September 9, and the report period is up to September 5. |
| First click | 2 | Instagram – 1 (lead №2), Facebook – 1 (lead №3) | The model counts leads with the first visit made within the selected period. The lead is counted for the channel of the first visit. Lead №1 was not counted, since its first visit was made on September 1, and the report period is from September 2. |
| Last click | 3 | Google – 1 (lead №1), Instagram – 1 (lead №2), Email – 1 (lead №3) | The model counts leads with the last visit made within the selected period. The lead is counted for the channel of the last visit. All leads were counted, even lead №3, despite the fact that it was not created witin the selected period. |
| UShape | 3 | Google – 0,6 (lead №1), Instagram – 1 (lead №2), Facebook – 0,4 (lead 3), Email – 0,6 (lead №3) | The model counts leads where at least one of the visits was made within the selected period. |
| Linear | 3 | Google – 0,5 (lead №1), Instagram – 1 (lead №2), Facebook – 0,5 (lead 3), Email – 0,5 (lead №3) | The model counts leads where at least one of the visits was made within the selected period. |
| Time Decay | 3 | Google – 0,66 (lead №1), Instagram – 1 (lead №2), Facebook – 0,33 (lead 3), Email – 0,66 (lead №3) | The model counts leads where at least one of the visits was made within the selected period. |
| Inverted Time Decay | 3 | Google – 0,33 (lead №1), Instagram – 1 (lead №2), Facebook – 0,66 (lead 3), Email – 0,33 (lead №3) | The model counts leads where at least one of the visits was made within the selected period. |
Why Can Revenue Differ Depending on the Attribution Model?
When using different attribution models, you may see different revenue for the same deals. This is due to the fact that in some models some visits may not be counted: for example, if they do not match the specified date or the filter conditions in the report.
Example 1: UShape revenue is higher than First click revenue
The period from April 1 to April 2 is selected in the report. The client made the first visit on March 31, the second visit on April 1, and the third visit on April 2. The third visit converted a lead. If the First click model is selected, this lead will not be included in the report, since the first visit was made before the specified period. If the UShape model is selected, the lead will be included in the report, since some visits of this lead were made during the selected period. Therefore, part of the lead value will be taken into account when calculating the revenue.
Example 2: First click revenue is higher than UShape revenue
Before creating a lead, the client made a visit from Google Ads, and then a few more visits from other channels. The value will be distributed as follows:
| Channel | Visit date | Value according to the First click model | Value according to UShape |
|---|---|---|---|
| A | April 1 | 100% | 40% |
| B | April 2 | not counted | 20% |
| C | April 3 | not counted | 40% |
Let's set a filter by channel in the report to take into account only visits from Google Ads. If the First click model is selected, the first visit will be assigned 100% value, and we will see all the revenue from the lead in the report. If the UShape model is selected, only 40% of the value will be assigned to the first visit, and subsequent visits will not be taken into account, as they do not match the filter conditions. Thus, according to the UShape model, we will see only 40% of the revenue from the lead in the report.